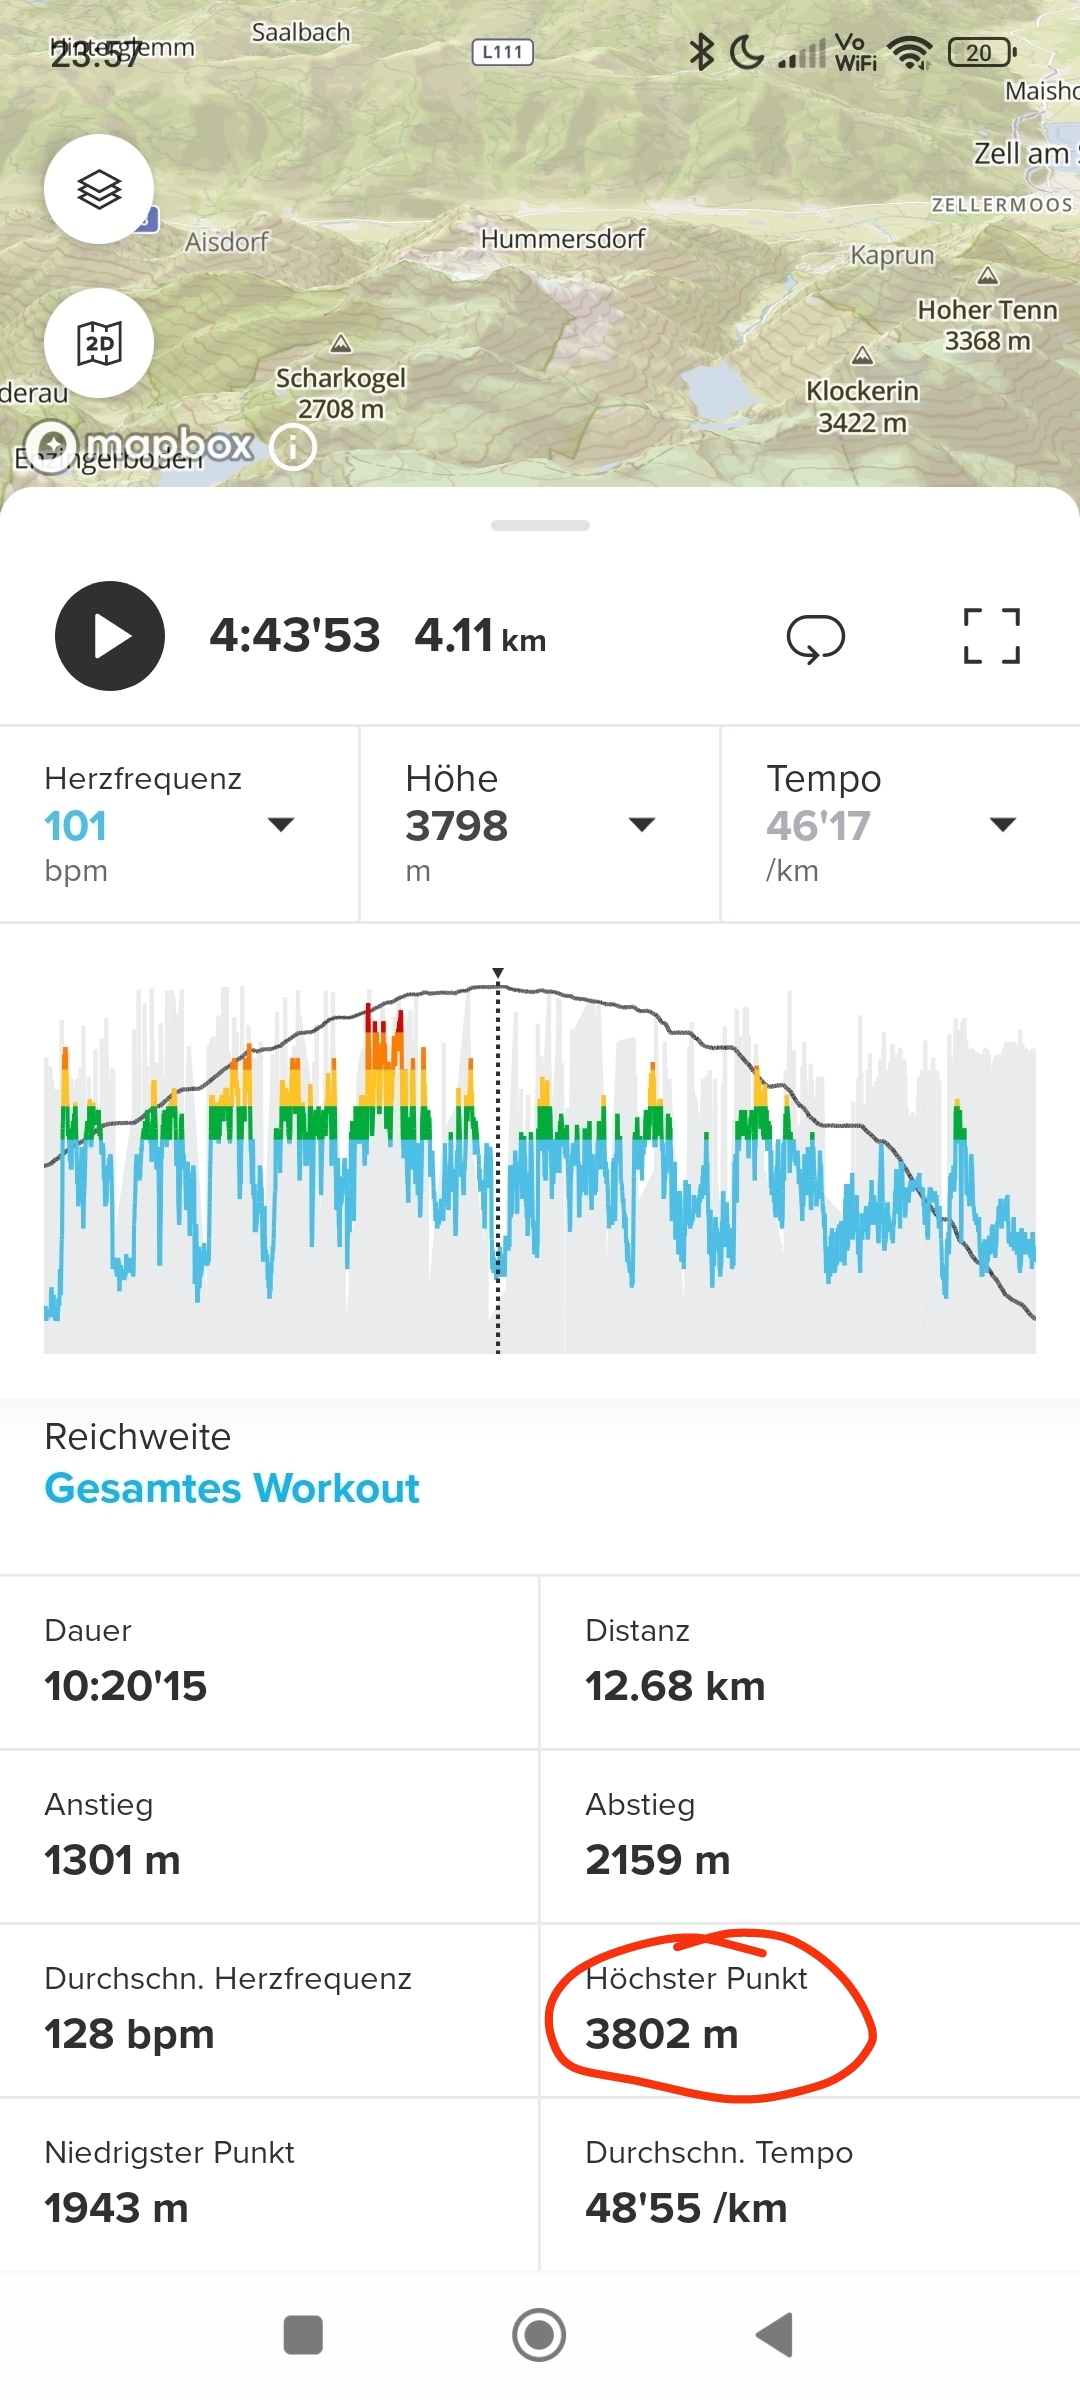
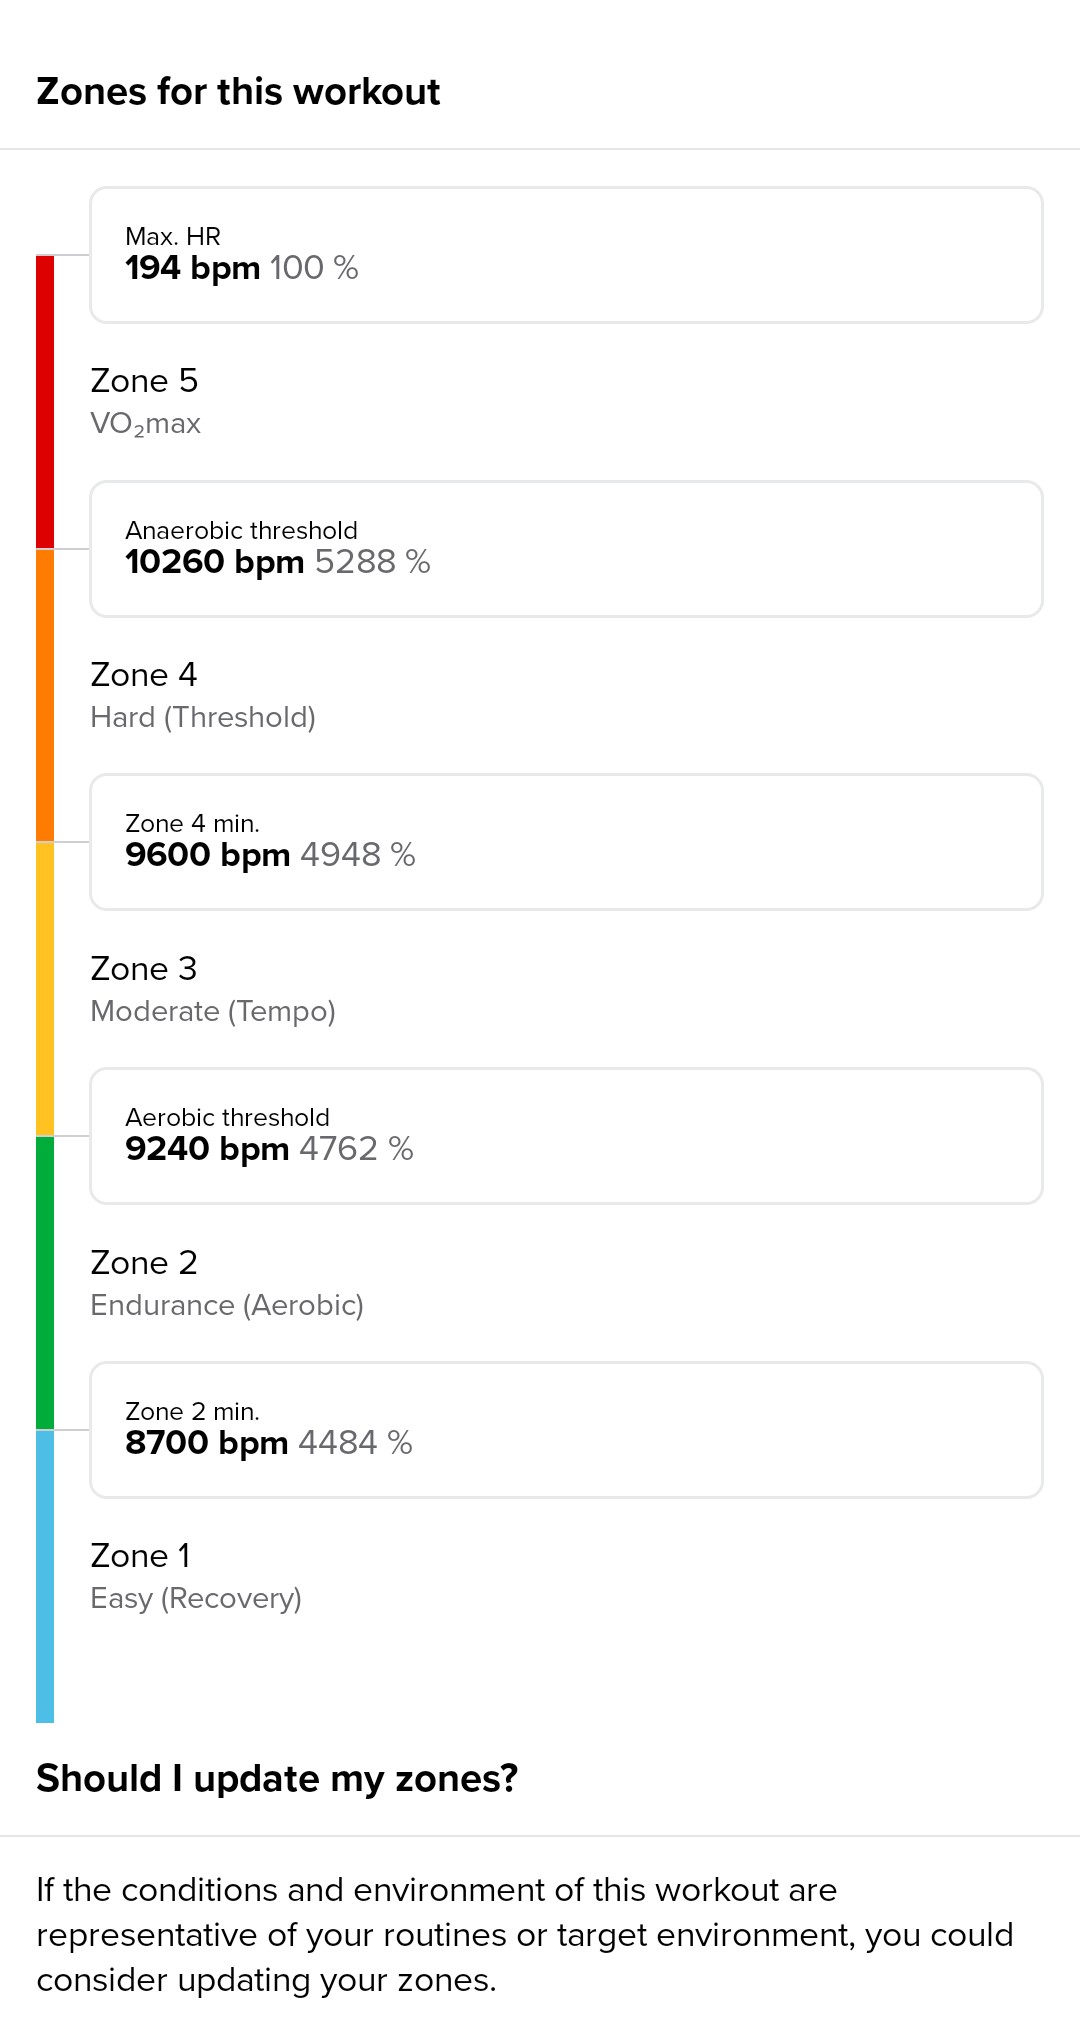
@André-Faria Yes, the synchronisation is still faulty; I can see the problem lies with Suunto. Suunto can’t retrieve heart rate zones or calories from the Karoo. Interestingly, it does display calories from Rouvy, but not the zones either. Naturally, it doesn’t display power zones either.
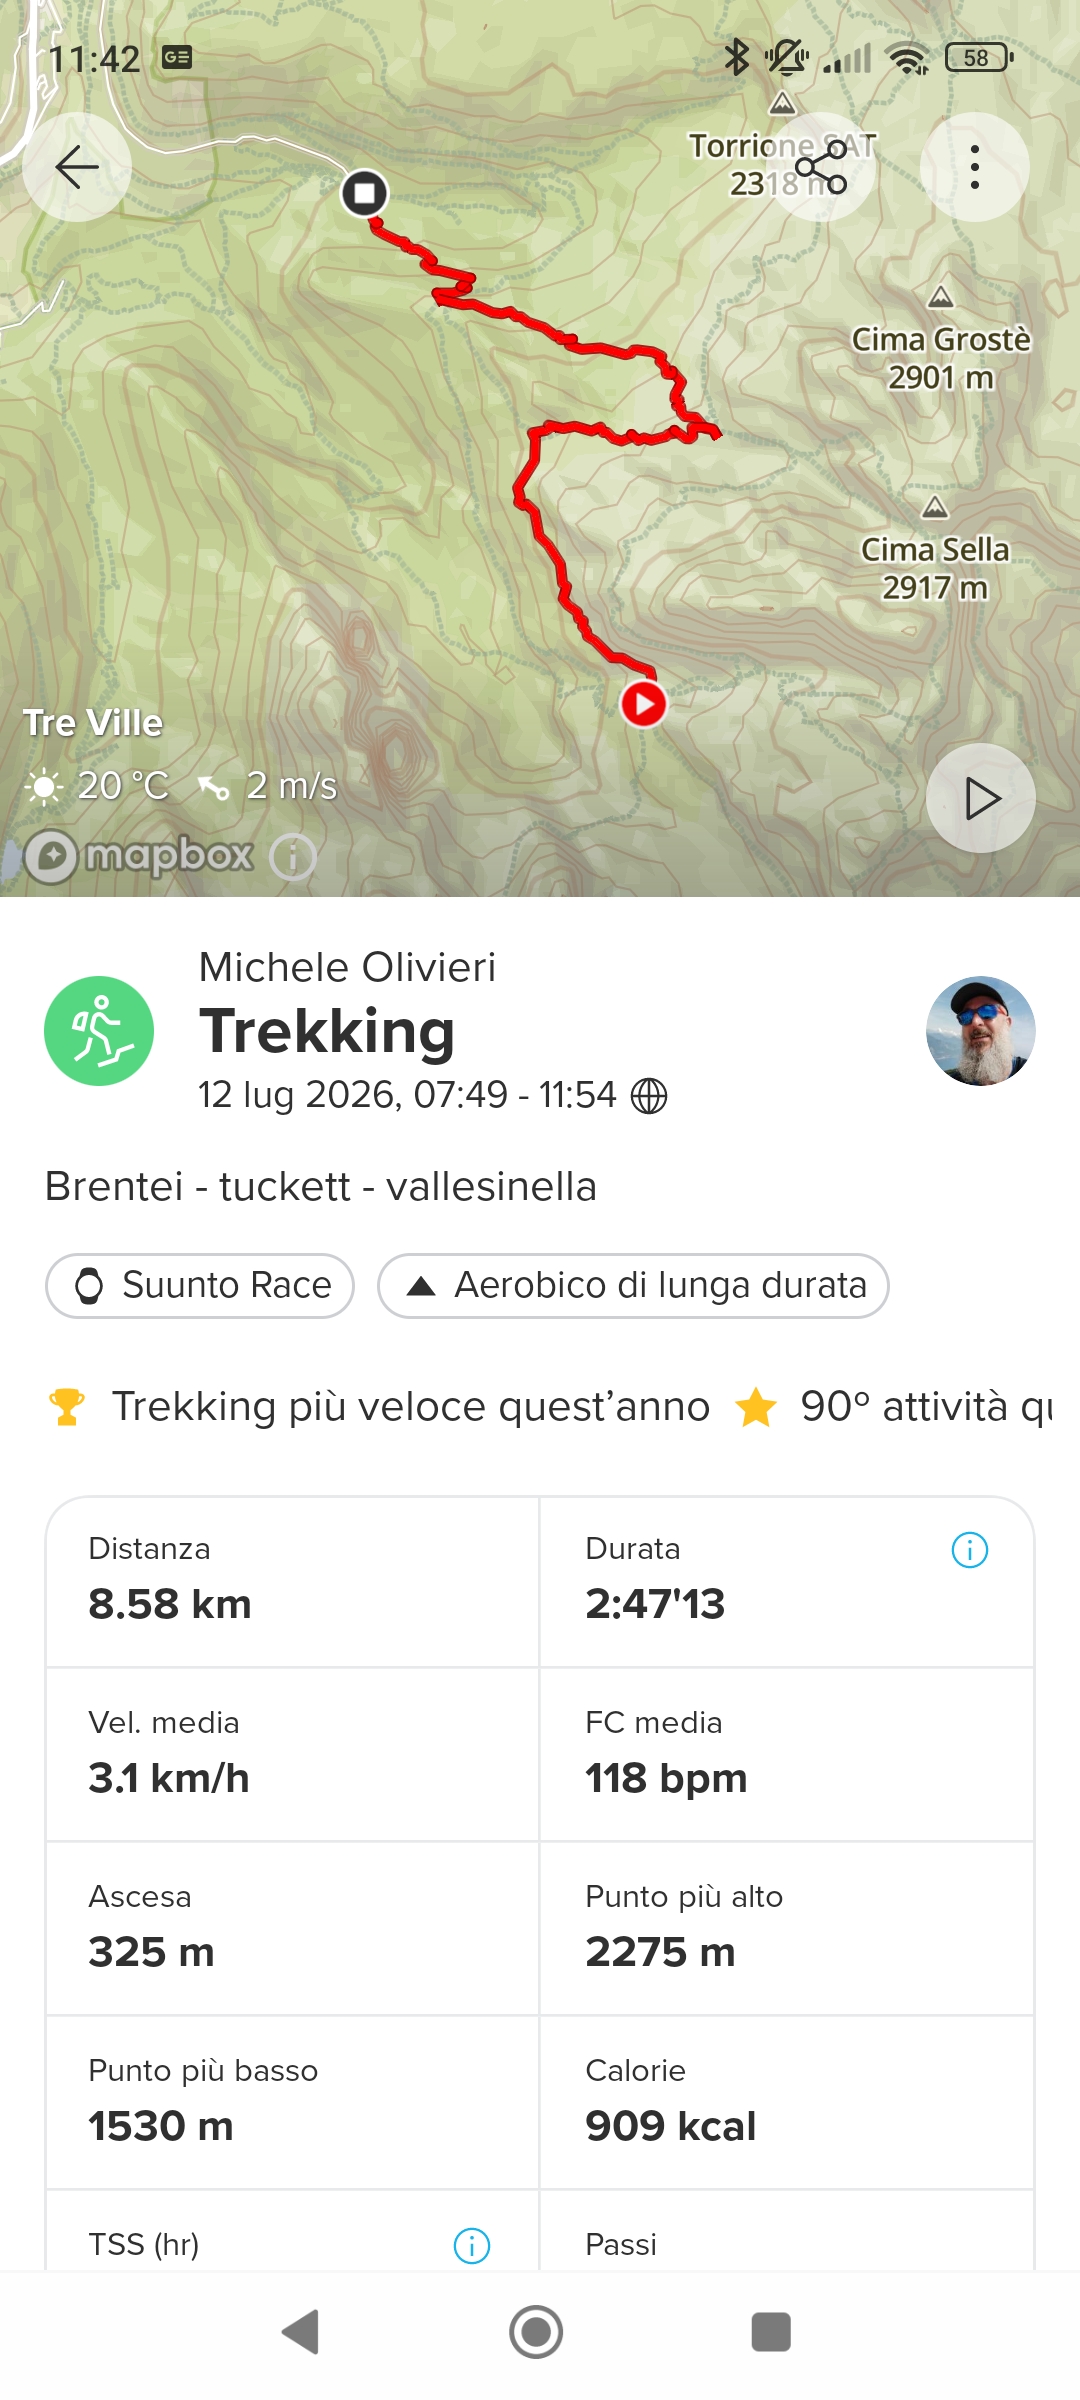
Strava displays all the information from both sources, i.e. Karoo and Rouvy.
Fortunately, I’m just an amateur; I still find this ecosystem more to my liking than Garmin.