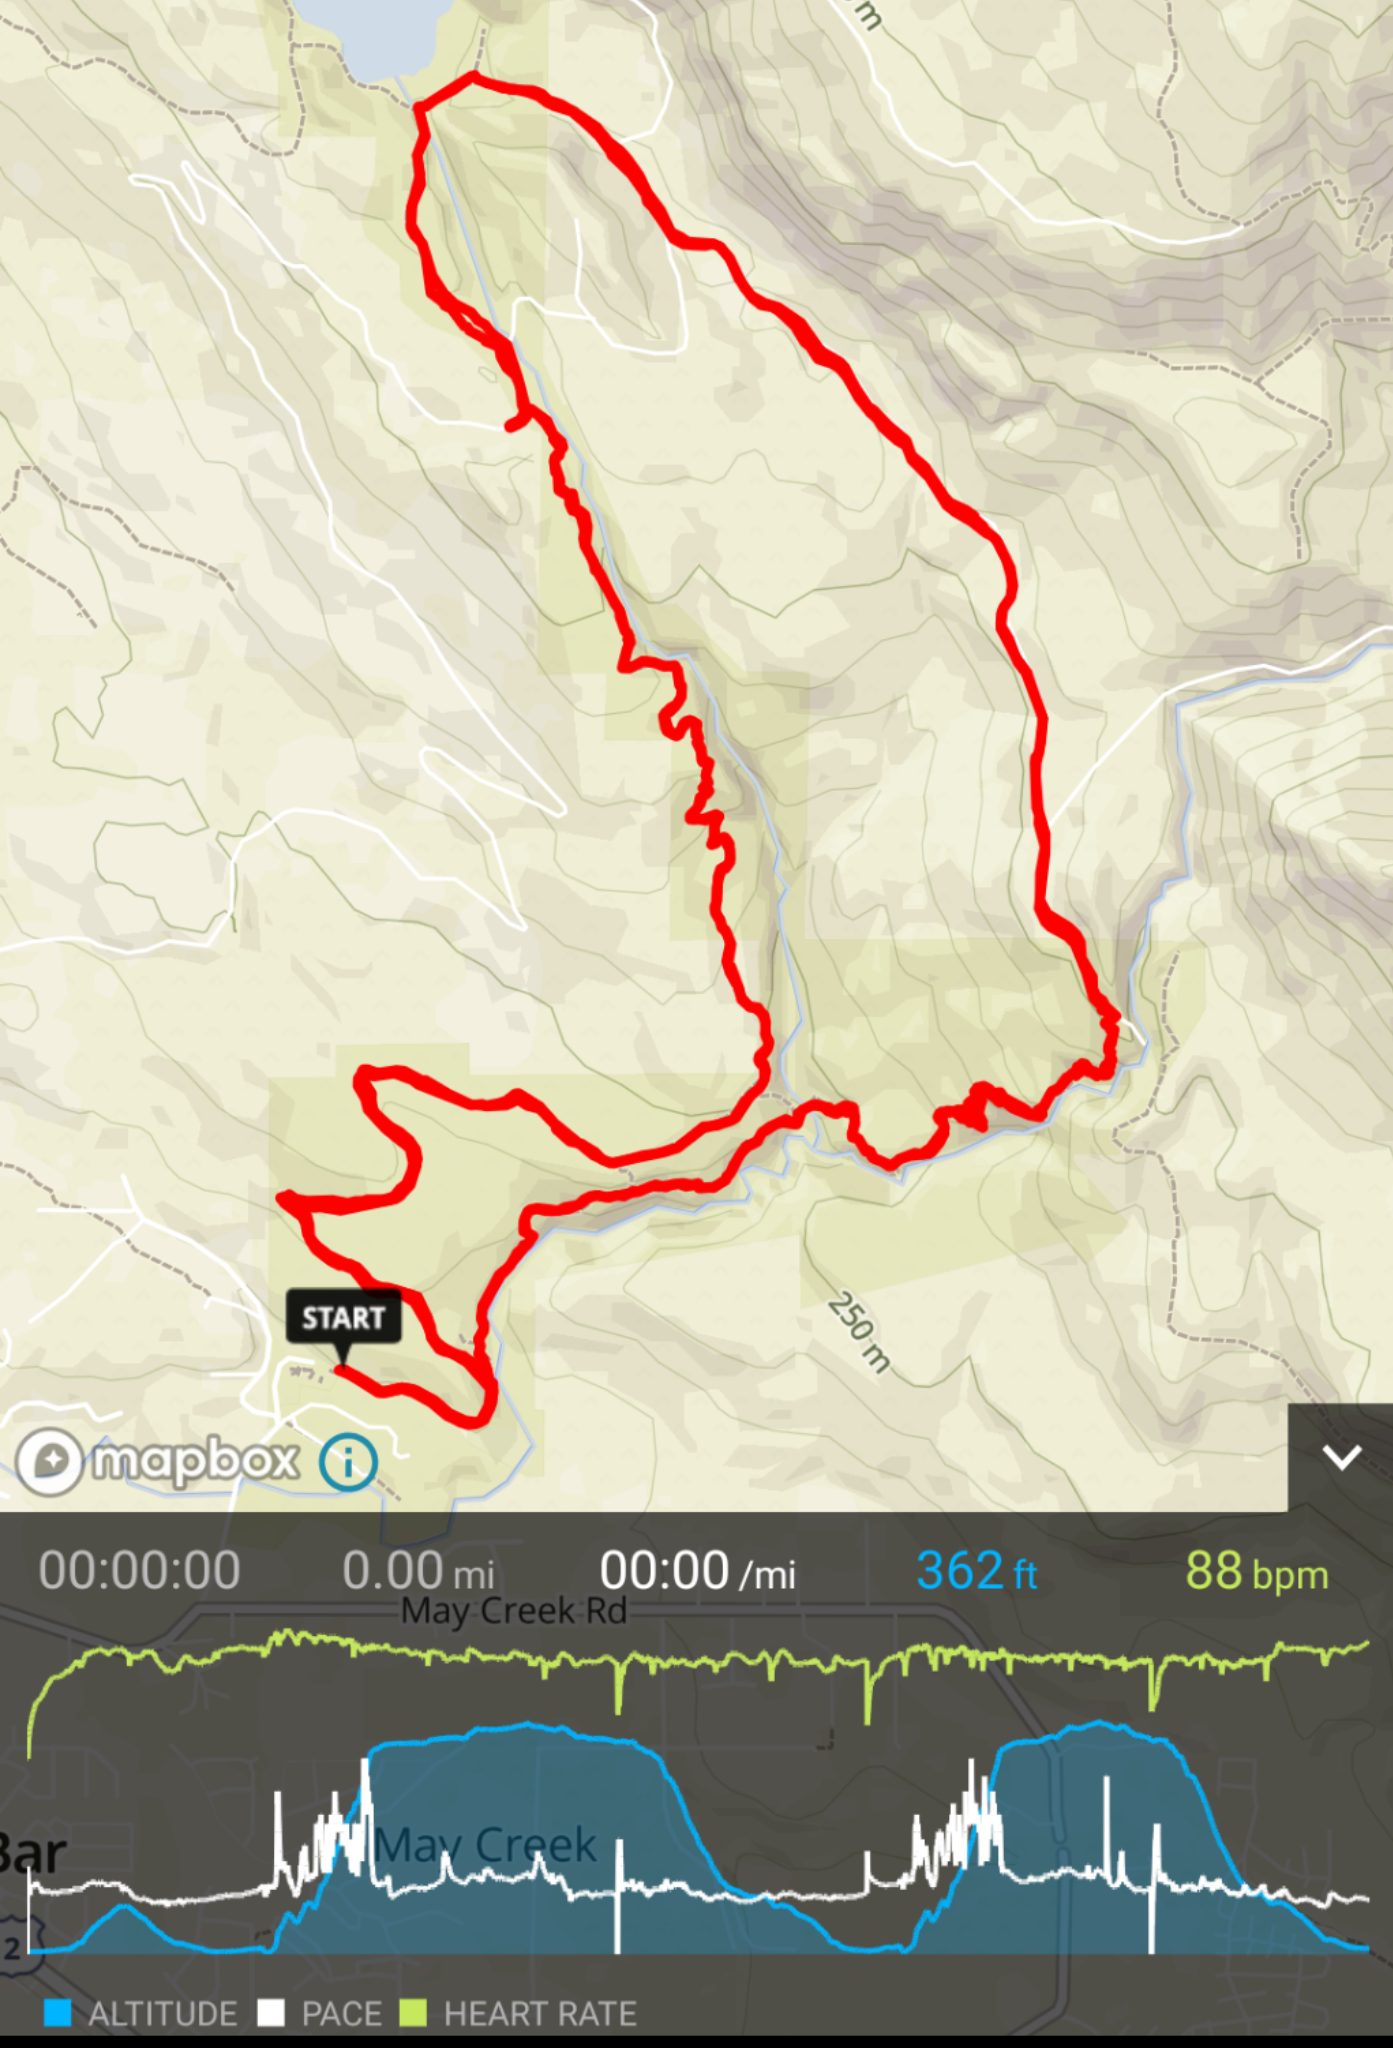
Incompetent graphs
-
@estevez Answer if you want: when did you test for the first time SA beta?
-
@ColdBeer I have been using it cca 4-5 days (I know it´s a few days), however I am using Movescount.com primarily…
-
Hi all,
I can acknowledge that new charts and fullscreen will be in the next betas to arrive here.
Do you want some sneak peak?
-
@Dimitrios-Kanellopoulos said in Incompetent graphs: Do you want some sneak peak?
Are you joking? Sure!
-
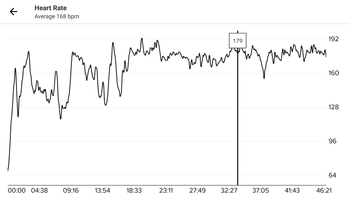
The above is FullScreen FYI (click to zoom)
-
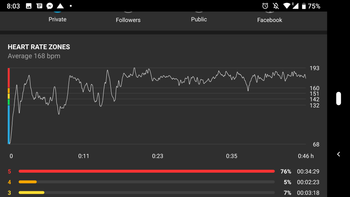
Also horizontal view -
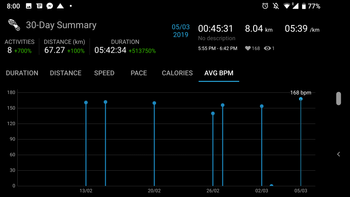
Same for analysis
-
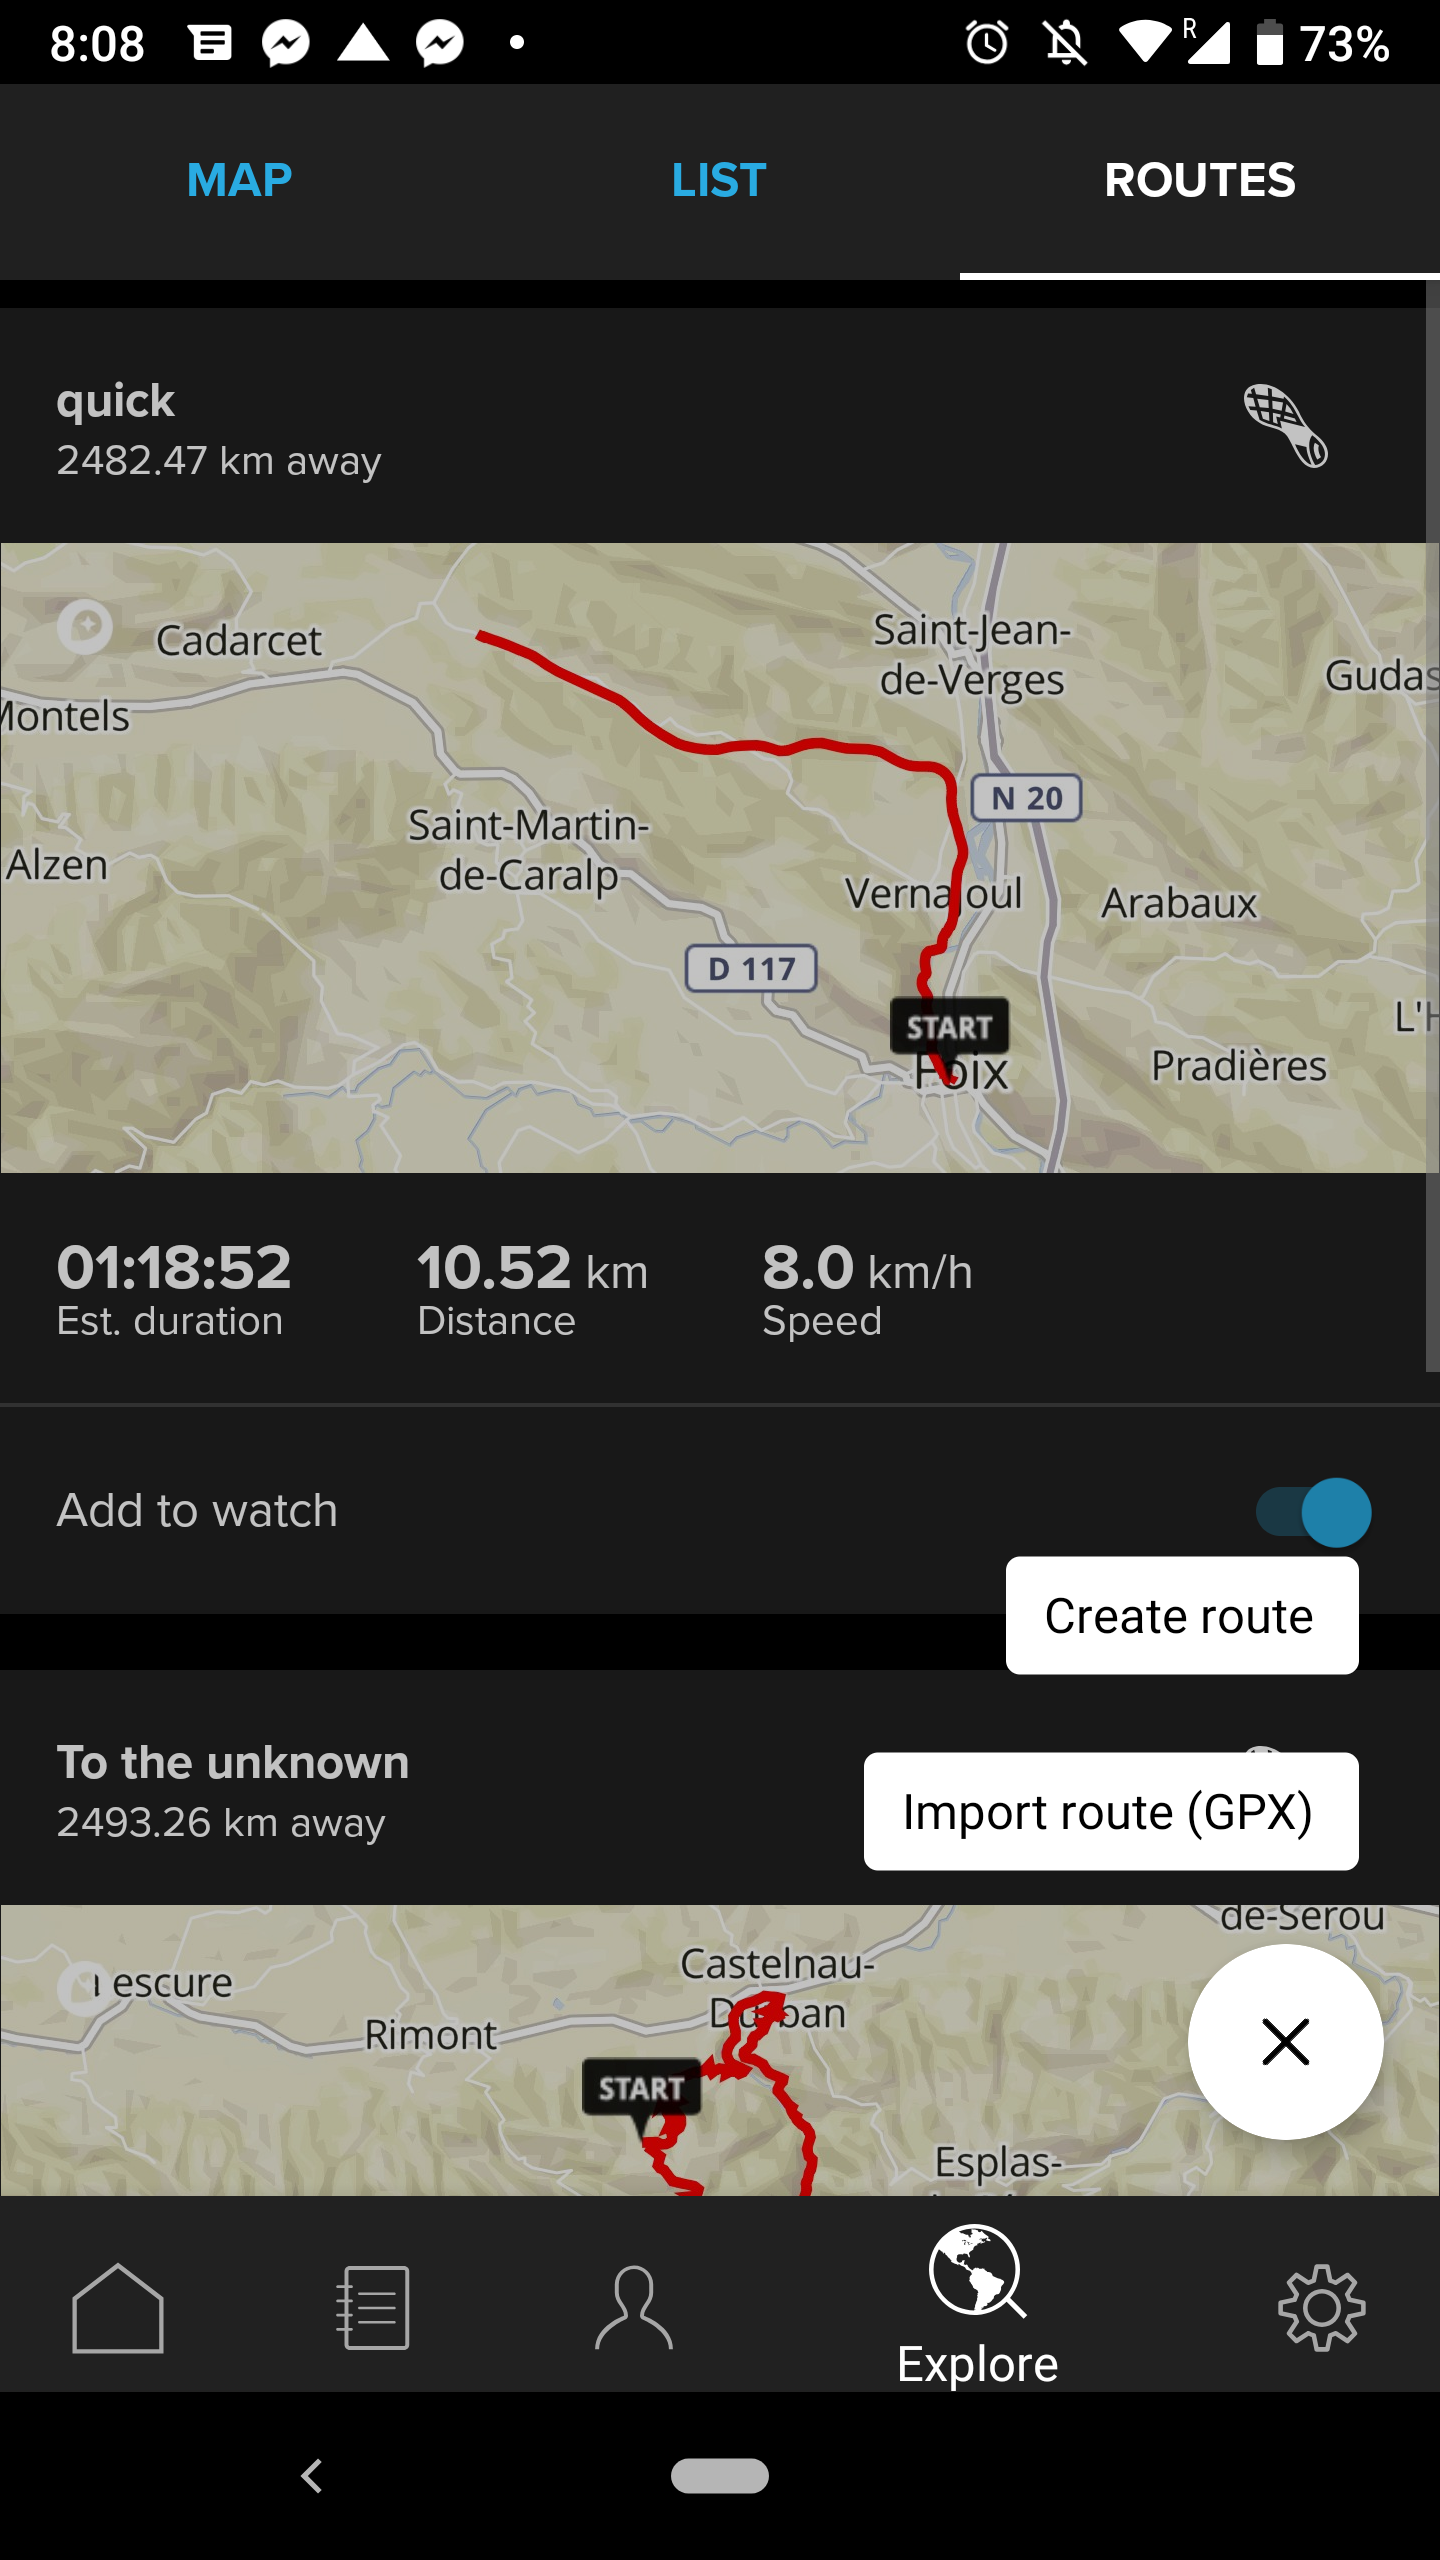
There are other goodies as well
-
We listen, we do listen to the users and we do our best to deliver.
If that does not meet your requirements for x,y reason then it’s ok. At least we try our best

-
@Dimitrios-Kanellopoulos said in Incompetent graphs:
There are other goodies as well

Hi,
Any chance that it works with Ambits 3 ?
Thanks for the news anyway
-
@remib no not yet any news for Ambits. We got tons of feedback that ambits do not like / want the suunto app so there is alignment first to be done
-
@Dimitrios-Kanellopoulos said in Incompetent graphs:
There are other goodies as well

So Helsinki is about 2490km from Pyrénées
 .
.
Enjoy pal and thanks for the news. -
@Mff73 thanks man. Its far ain’t it? And cold too
 But to be honest, its not that much as imagined.
 -
BTW the time in the charts, in regards to prev conversation it’s linear as it should be.
In my screen above I worked out for 46 minutes to putting 4 segments on the chart should be increments of 46/4 = 11,5 minutes as seen -
@Dimitrios-Kanellopoulos said in Incompetent graphs:
@remib no not yet any news for Ambits. We got tons of feedback that ambits do not like / want the suunto app so there is alignment first to be done
Can you explain what do you mean by alignment ?
Nb: if you “push” a little ahead to Gavarnie, you might get the cold you expected

-
@remib Gavarnie looks fantastic!

I cannot share more on this subject, also different thread is needed. A quick example would be that a lot of Ambits 3/ Traverse have issues come connectivity issues from our feedback so #1 prio is to make the basics right for them before we jump to maps etc, where more people end up having connectivity issues trying to use features they would like to.
-
@Dimitrios-Kanellopoulos said in Incompetent graphs:
above is FullScreen FYI
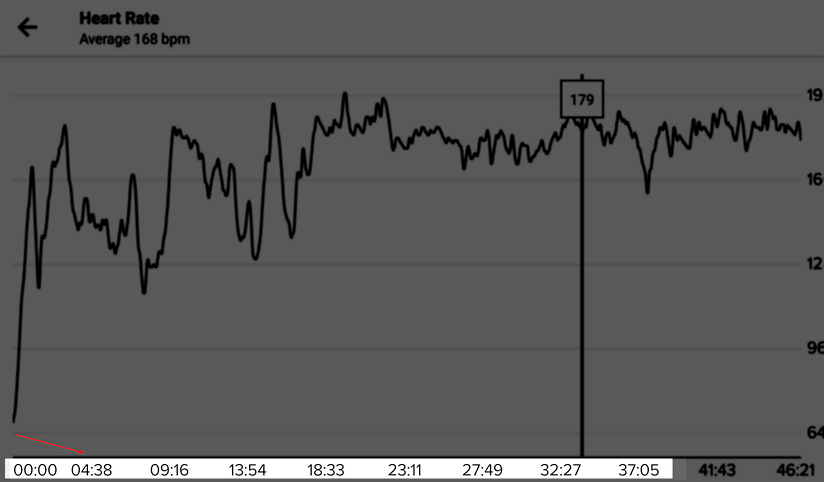
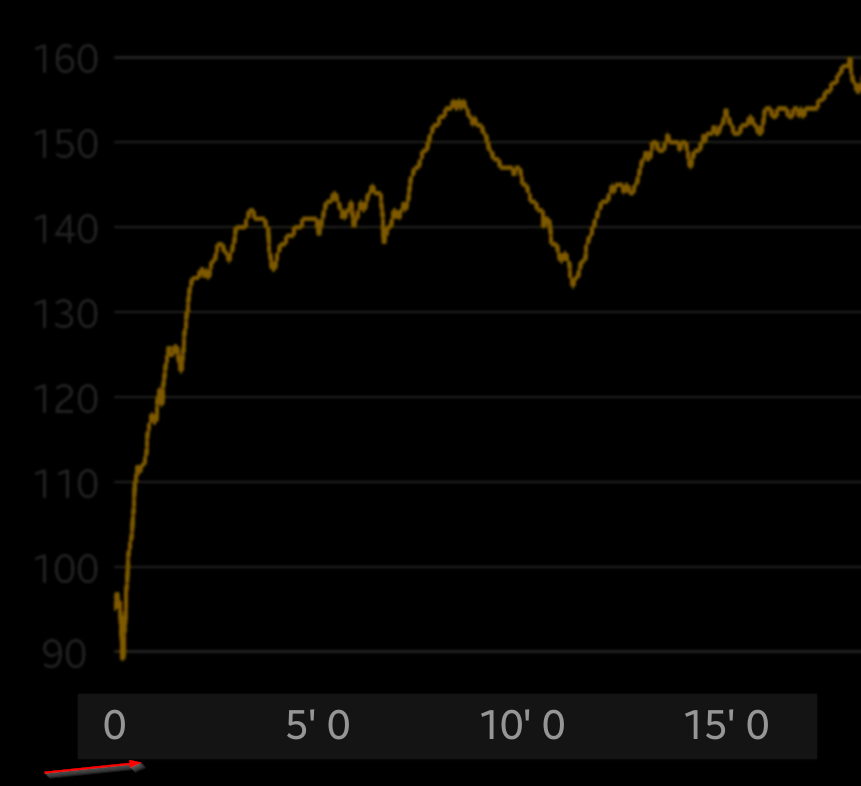
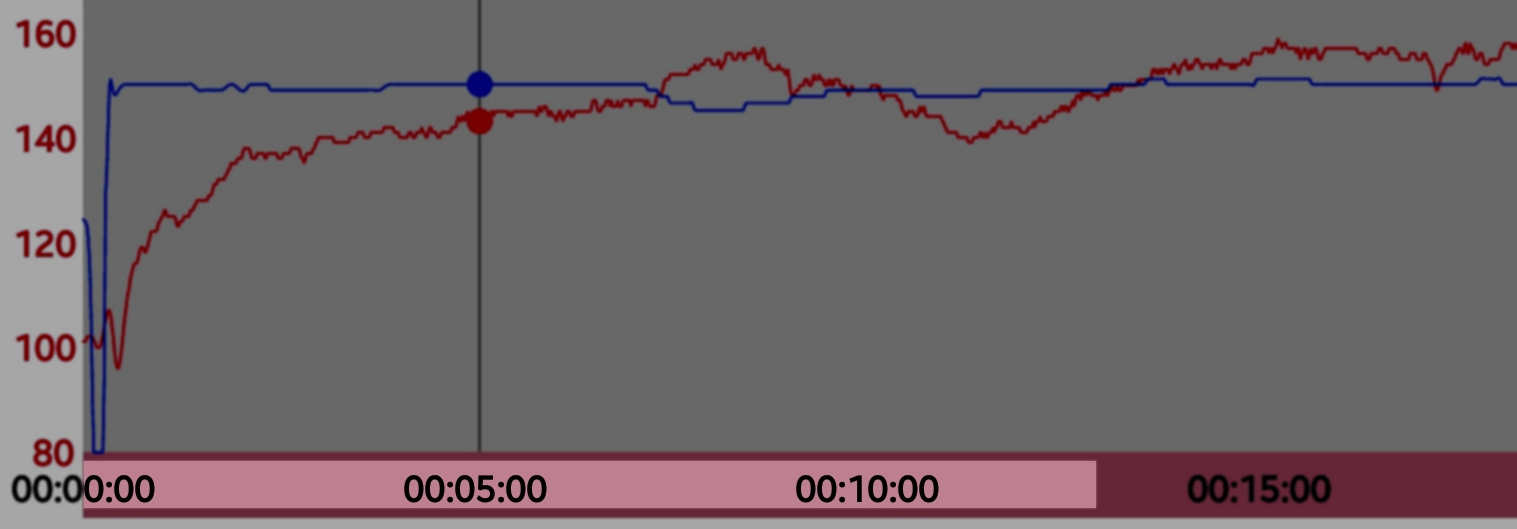
cool, goes into right direction, suggestion: can we normalize the x-scale to full/rounded integer instead current granularity of e.g. (your example here) 23:11 as half/50% of the total training duration? This didn’t add any value to an end user glacing on a 5 inch screen and creates unnecessary noise on the x-axes labels. Rather would prefer normalized value on x (aka comparable buckets of the plot) like 5/10/15min or 2/4/6/8min that is easier for comparing and didn’t add this noisy level on the graphs with the 4 digits , if I want second-to-second accurate data I would go anyway into the detail map view
Polar flow or movescount web/old mobile app does this as well *see below some examples)
current SA (lot of digits on axes, not normalized):
movescount web (rounded full integers, normalized):

old movescount mobile app (normalized):
Polar flow (normalized):
-
@Tobias-F Great idea about the normalized number on x axis. I wanted to suggest the same this morning but didn’t have time. In addition to removing clutter that would also make it easy to estimate values in between by glancing at the graph. For example you know instantly that there is 7:30 between 5:00 and 10:00 but the same isn’t true for arbitrary time labels. It would be great if numbers on y axis were normalized too.
-
@silentvoyager said in Incompetent graphs:
make it easy to estimate values in between by glancing at the graph
fully agree!
-
Yeah good points here. Ill pass those to the developers asap. Thanks guys. Good morning from here.
