HRV on Vertical
-
@Swaddy61 I’ll join in on the days correlation (who doesn’t love science and statistics!) So I’ll keep a chest strap on the night stand.
I’ll do morning side by side comparisons to see if we can’t get a plot going but it seems to line up from what we are seeing. I’m more of a trend versus an absolute kind of guy so as long as it tracks I’m less concerned about the raw number (just so you know how I think )

-
@Stefan-Kersting said in HRV on Vertical:
Yes a lot is individual. When skiing with my buddies they are laughing at me because of my high max HR. I am 47 and when pushing myself I can have a HR of 194 (measured with belt). I was litt worried about that because usually you calculate max HR = 220-age. And that does not work for me. I read something about that this formula is not up to date any more and so I was less worried about my HR. I think it is the same with the HRV.
Both max HR and HRV average will be determined more by genetics than by anything else. I am 66 and my max is near 180, when I was in my early 40s it was in the low 190s. I have friends much younger and faster than me that have max HR in the high 160s.
-
@Todd-Danielczyk you cannot compare the absolute HRV numbers from Suunto and HRV Elite.
Suunto reports the HRV in milliseconds while the HRV Elite app reports a HRV score which has no unit. It is a score which is normalized to be between 0 and 100. They take the RMSSD measurement (in milliseconds) and apply the natural logarithm to this value and then do some normalization.
So you can only compare the trend between the Suunto measurement and the HRV Elite measurement just as you are suggesting. These values are apples and oranges

-
@Mads-Hintz-Madsen I agree 100%. For me the Vertical has been tracking well with my sleep and daily “feel”. I have been more than happy with the data I have gotten from it since the last firmware update. My sleep and HRV been reading very consistent to my daily life. Days I’ve been busy with work, dehydration, alcohol consumption and late nights have shown worse HRV. Regiment structure shows better HRV.
I think the little experiment we discussed is to show the variance between the two testing types so that we can put the “XYZ shows a way better number than my Vertical does”. If one method reads statistically higher on trend then the other we can say it makes sense.
For me the track is more important than the individual point. So far the Vertical is tracking very well for me.
-
@Mads-Hintz-Madsen Thanks for this explanation. I also just found in the deep list of results graphs on Elite HRV one that shows rMDSS, which shows the same values as Suunto (and matches Suuntos explanation in SA)
You are right. HRV score and rMDSS are different values/scores but based on the same calculations/test, and its the trend we need to pay attention to.
Back to Suunto app!
-
@mikekoski490 @Mads-Hintz-Madsen Agree 100%, and also about the Elite App. And I am also getting very close correlation between the Suunto HRV value and the Elite rMDSS, so I think we can now safely rely on the Suunto App trends as our guide.
Good work all!
-
I’m just about to watch this video as I’ll admit I’m not fully up to speed with understanding everything about HRV. FWIW I follow him on YouTube and he’s usually right on the money

Heart Rate Variability (HRV): Measure Your Autonomic Nervous System (ANS)
0:00 Introduction: Heart rate variability explained
0:10 What is HRV?
1:47 What does an HRV device do?
7:05 Learn more about HRV in our training videos"Today, I want to introduce you to something called heart rate variability (HRV).
HRV is a measurement of the variations between the heartbeats. There are different time distances between your heartbeats.
The more varied the timing is between the heartbeats, the healthier a person is, and the higher the HRV is. The less varied the timing is, the less healthy the person is, and the lower the HRV is.
HRV measures the autonomic nervous system. It has been well-researched and can help a person understand their ability to adapt to and recover from stress.
Many people use this technology to determine whether or not their body can handle the stress of working out on a given day. Maybe they can handle doing high-intensity training one day, but their body would do better with a day off or with low-impact exercise the next.
There are many different lifestyle changes you can make to help improve your overall health. HRV technology can help give you feedback to see if what you’re doing is actually benefiting you. It can even tell you your biological age and rate of aging.
You really can’t take your health to the next level if you can’t measure it. This is a fantastic and easy-to-use tool to help you do that right at home."
-
@MiniForklift bonjour j’ai juste une question au sujet de ces hrv est il possible de réinitialiser les score de vfc ?
-
@ggrego les valeurs vont s’actualiser progressivement toutes seules (premières mesures après 14 jours, puis tu as la valeur moyenne des 7 derniers jours, et ensuite la plage de VFC s’actualise sur 60 jours courants)
(probably only a hard reset would also reset VFC values)
-
@Tieutieu ok merci
-
@Tieutieu said in HRV on Vertical:
@ggrego les valeurs vont s’actualiser progressivement toutes seules (premières mesures après 14 jours, puis tu as la valeur moyenne des 7 derniers jours, et ensuite la plage de VFC s’actualise sur 60 jours courants)
(probably only a hard reset would also reset VFC values)
I will continue in English for more global question.
Not just for you @Tieutieu, 🤭.
Is the HR normal range calculated during the 14 first days, is also updated in case it “changes”?
Otherly said, what is “normal” for 14 days, will it stay normal forever?
I did’t really note what was my normal zone from beginning, but it seems not to have changed (which could be normal… Or not)
-
@Mff73 Having read quite a lot of documentation on the Suunto site I ‘think’ it sets your ‘normal’ range during the first 14 days, and after that gives a rolling 7 day average.
I have not seen it written in the official documentation (not saying it isn’t there, but i haven’t found it yet) that your ‘normal’ range gets updated after the 14 days, although the 7 day rolling average definitely does. It would be interesting to get a definitive answer on that.
-
My complaint with the current implementation is that it takes a few days for it to report a non baseline reading. I had the flu BAD and it dropped my HRV by 30 some points. The vertical picked this up but didn’t start providing any advice based on this for a 3-4 days after the initial drop
-
This morning the HRV data for the last night is 25 ms on the watch, in the app 26 ms. Because of only 7 readings, there is the message “no data” on the widget. The 7 day average is equal.
-
interesting conversation about hrv.
i think it is interesting to measure for trends, illness etc.
i had two days were my hrv were off and i felt tired a bit ill.
the only setback is, that the 7 day average was in the optimal range, green light and the suunto app and watch states optimal recovery.
i was not optimal recovered on the two days. so i recommend everyone to look more on the daily hrv in relation to the normal range, then to look if the 7 day average is in the normal range.
maybe it is possible that this will be represented in another way in the suunto app and on the watch in the future. -
@Sebastian-Wagner-0 said in HRV on Vertical:
so i recommend everyone to look more on the daily hrv in relation to the normal range
This is what I do with the nightly average in the morning. More days with low values will bring down the 7 days average.
I remember that Garmin does it in the same way with the advice, to slow down the training on a day with a low value according to the personal feeling.
-
@pilleus Yep, me too!
-
@Sebastian-Wagner-0 said in HRV on Vertical:
interesting conversation about hrv.
i think it is interesting to measure for trends, illness etc.
i had two days were my hrv were off and i felt tired a bit ill.
the only setback is, that the 7 day average was in the optimal range, green light and the suunto app and watch states optimal recovery.
i was not optimal recovered on the two days. so i recommend everyone to look more on the daily hrv in relation to the normal range, then to look if the 7 day average is in the normal range.
maybe it is possible that this will be represented in another way in the suunto app and on the watch in the future.this is my same complaint

-
I only see random variation in my HRV, and no trend or indication when I get sick. So between that and the inaccurate sleep tracking, I just turned it off (24/7 HR). Resting HR seems to be ok though.
I know there’s not a huge battery hit, but just felt like it was more noise.
-
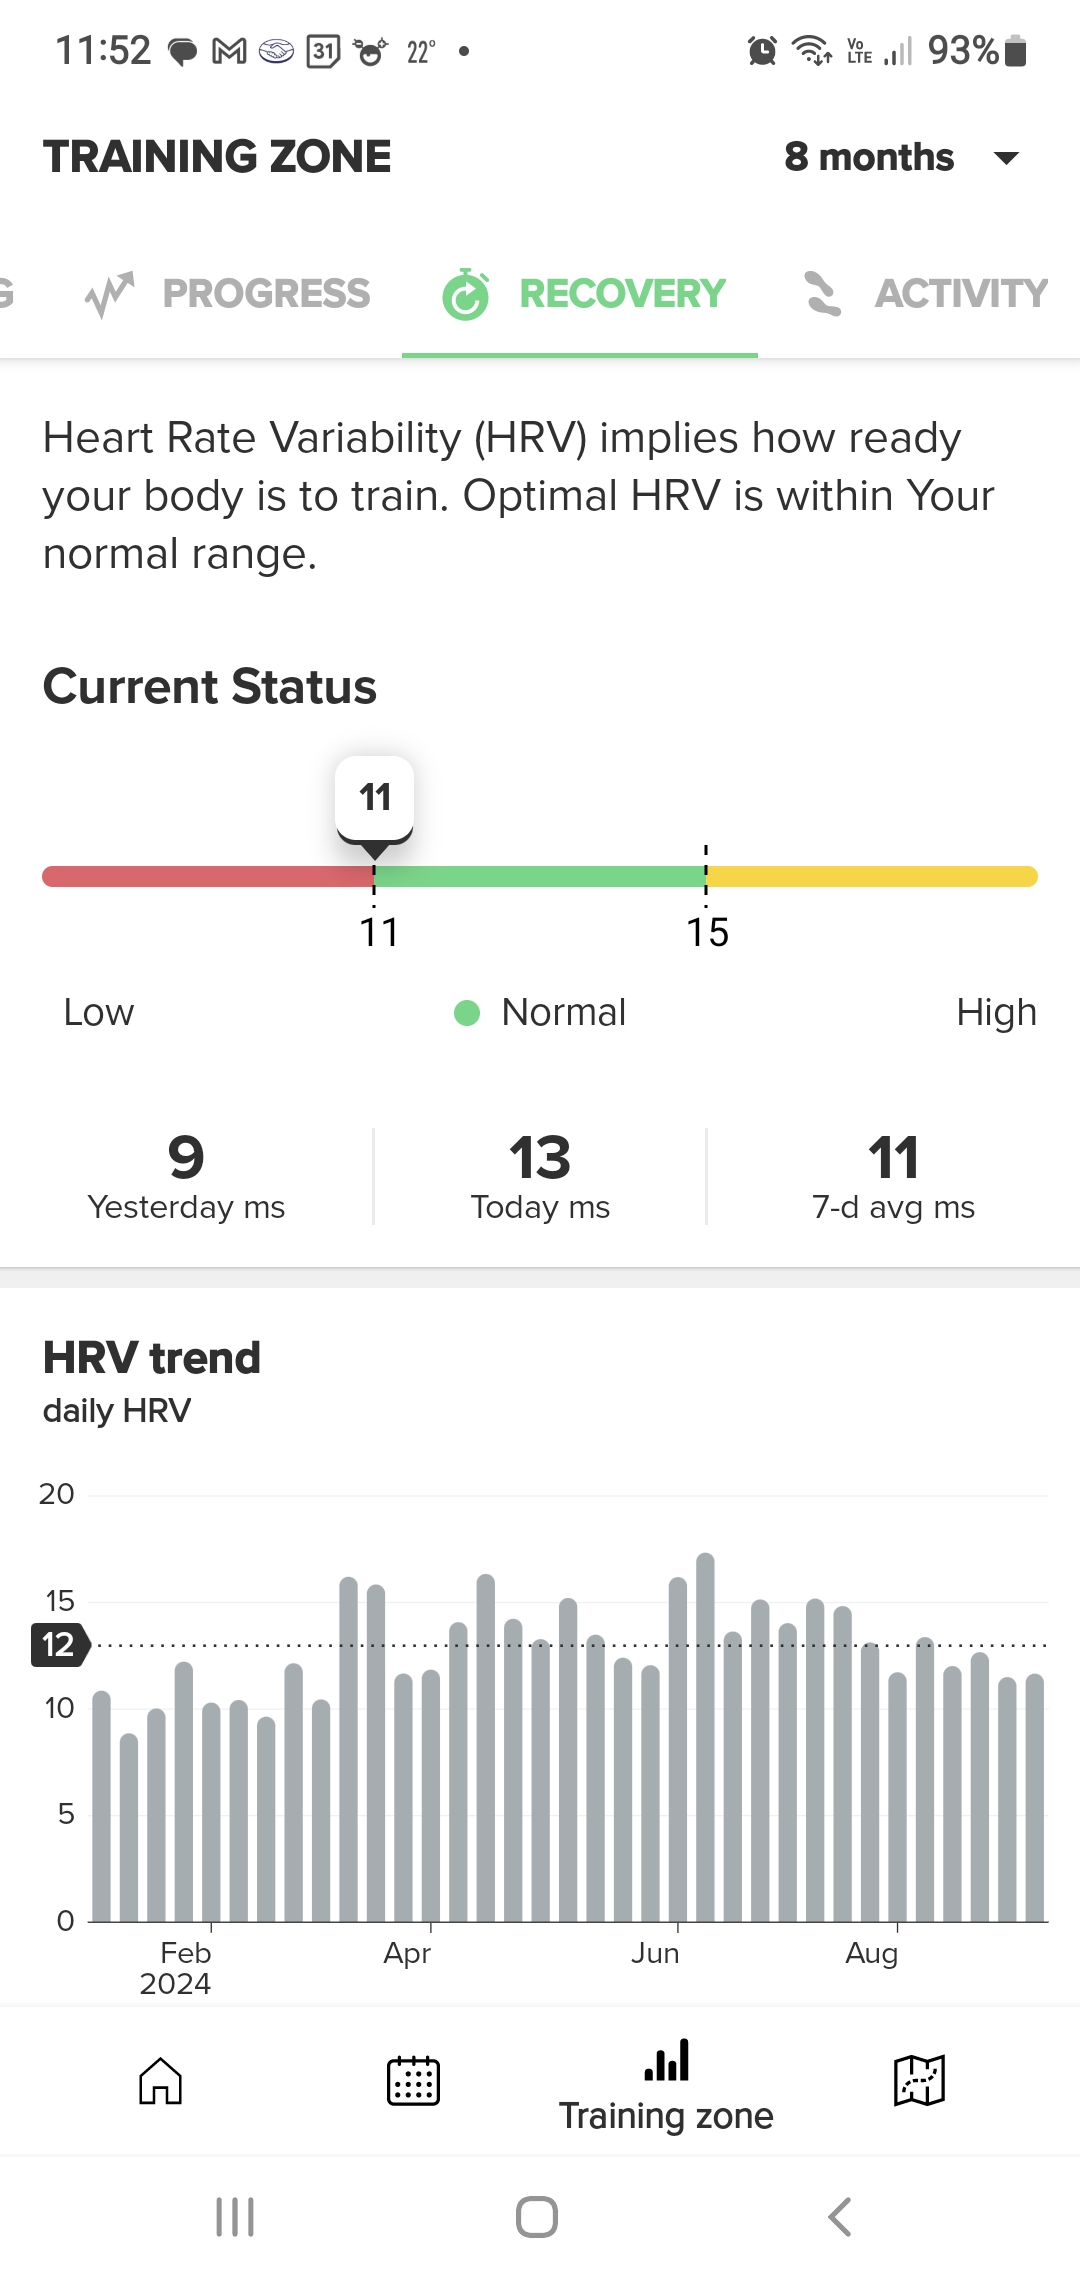
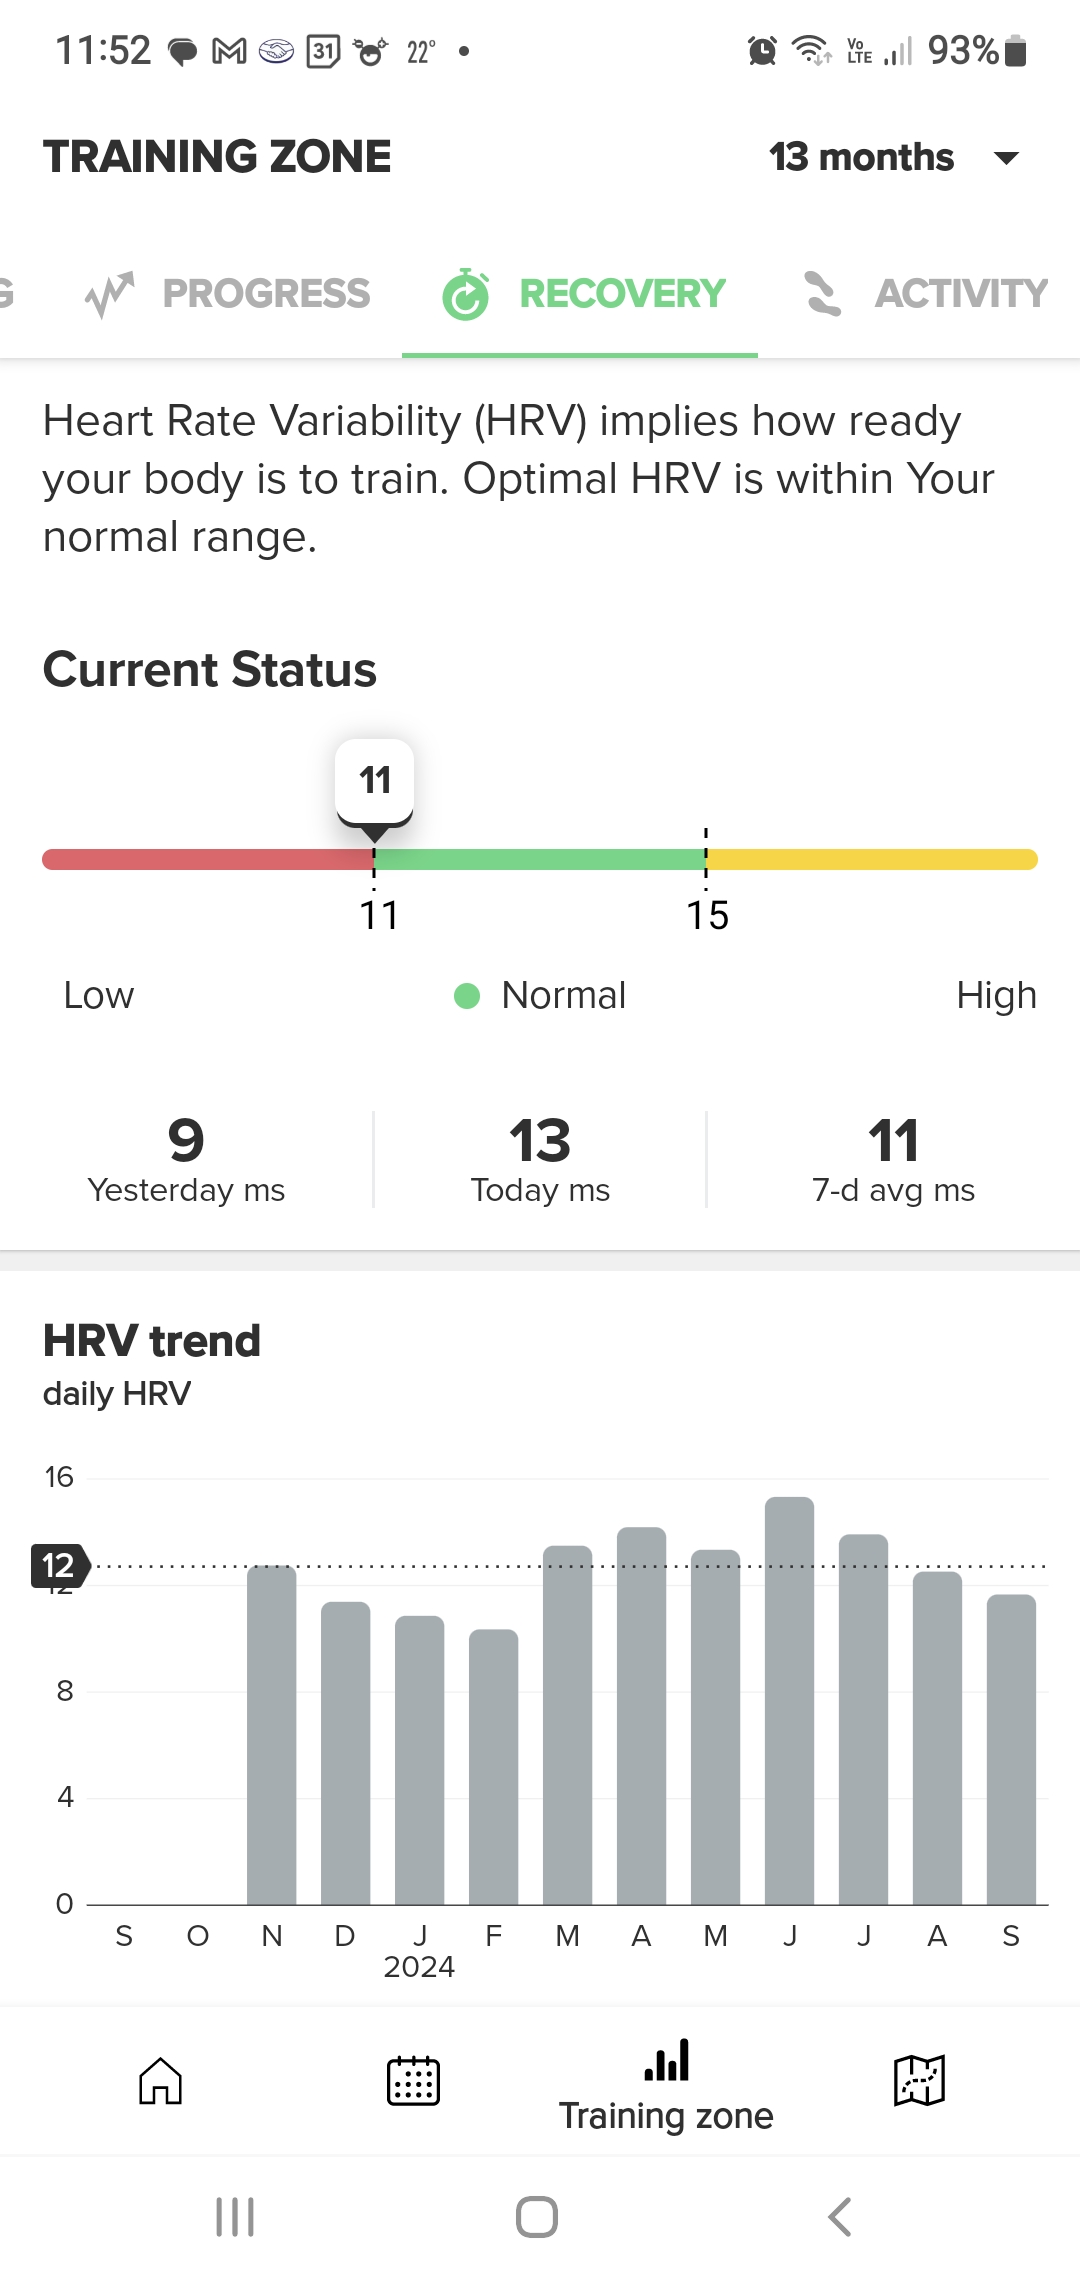
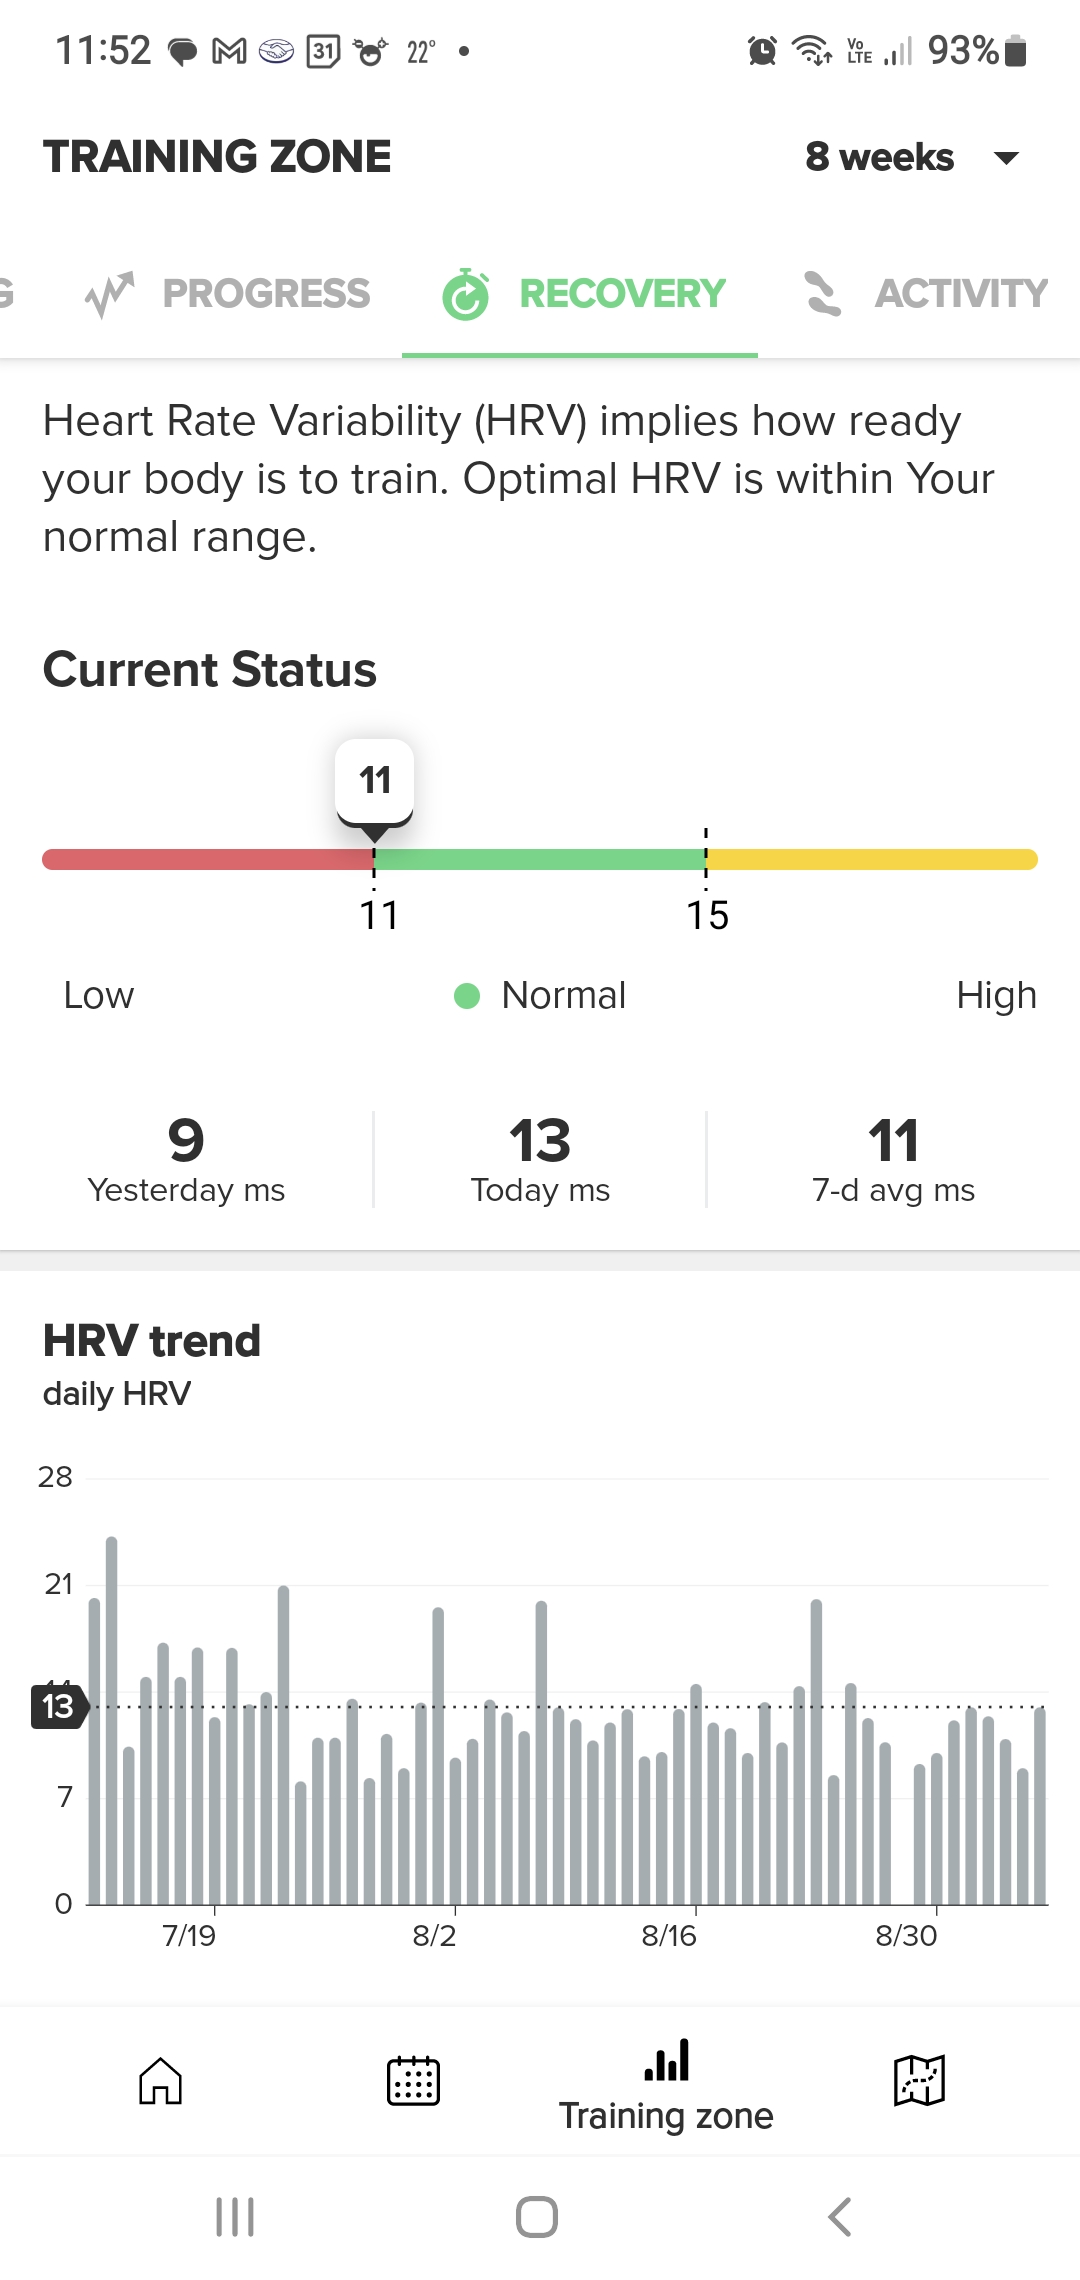
this are my HRV stats.
I am 66 with diabetes and hypertension. Both controlled.*Juan Alberto Garcia Rivera Mexico
Leon, MexicoSuunto X6
Polar AXN 700
Polar S710i
Galaxy Watch 7*!

