HRV on Vertical
-
@dombo As far as I know, Polar only takes into account the first 4 hours of sleep.
-
At first the absolute value is uninteresting, although it should of course be approximately comparable to other systems. As long as the upward or downward changes in HRV can be seen in the medium-term average, the value is useful and can be interpreted accordingly. For me it was 10 points less on the Vertical than on the Forerunner and Fenix. However, the intervals from one day to the next were identical.
-
@pilleus I agree with you. I’m seeing the same deltas day to day when I only look at changes between my Fenix 7x and the Vertical
-
hi guys, this morning first time to see my HRV range. my range is from 37 to 48. how about you guys?
i understand this normal HRV range is different for everyone. i just curious about you guys normal range.
Thanks Suunto for many cool stuffs after the latest update and great improvement.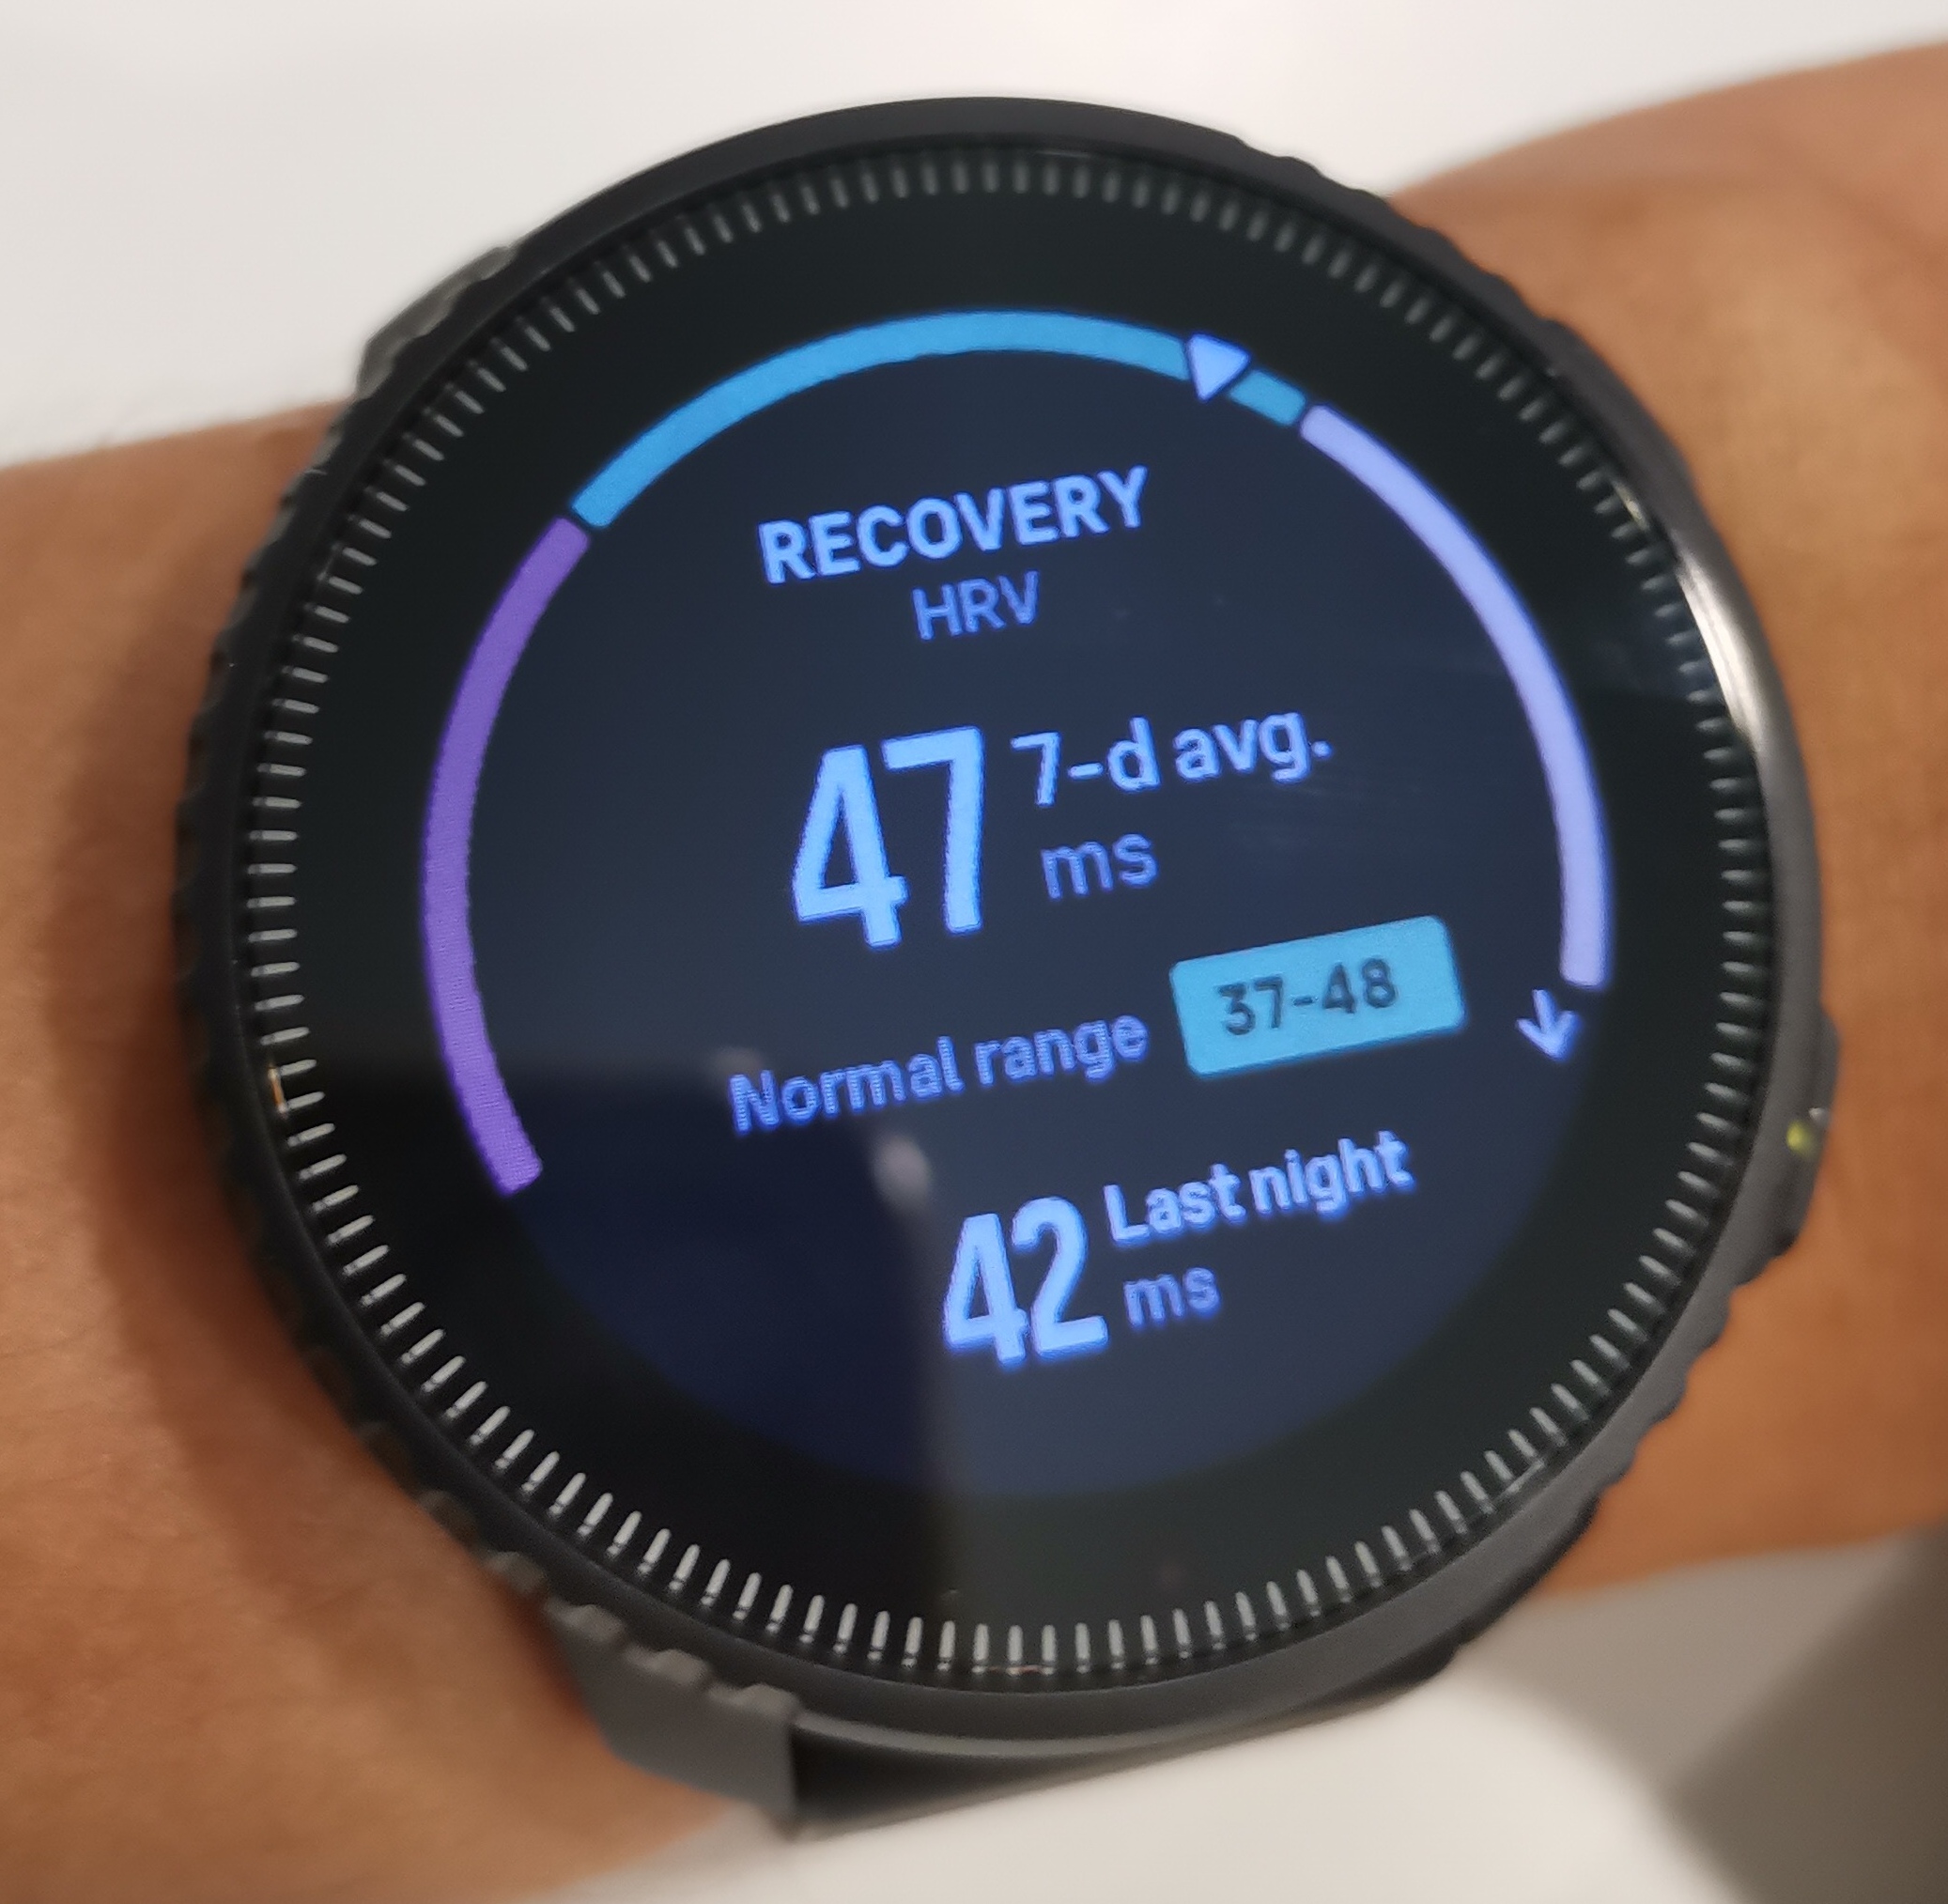
-
@babychai
Hey, me too .
.
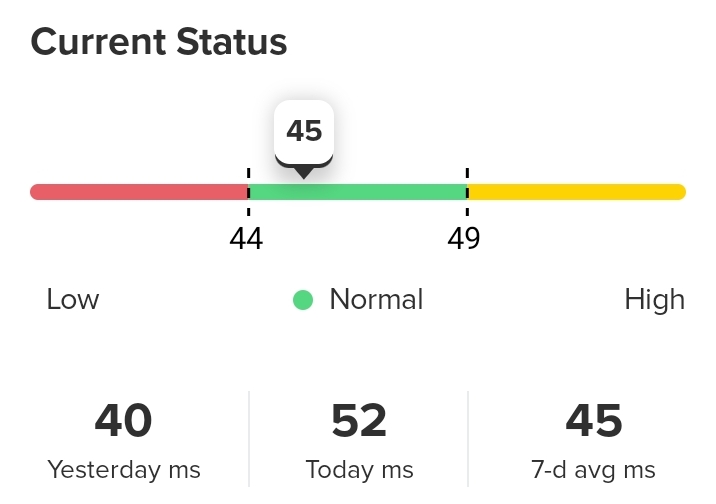
The range displayed on the watch is little offset than in the app (maybe it is range until midnight, and today’s HRV not yet taken into account? ) , but it is nice.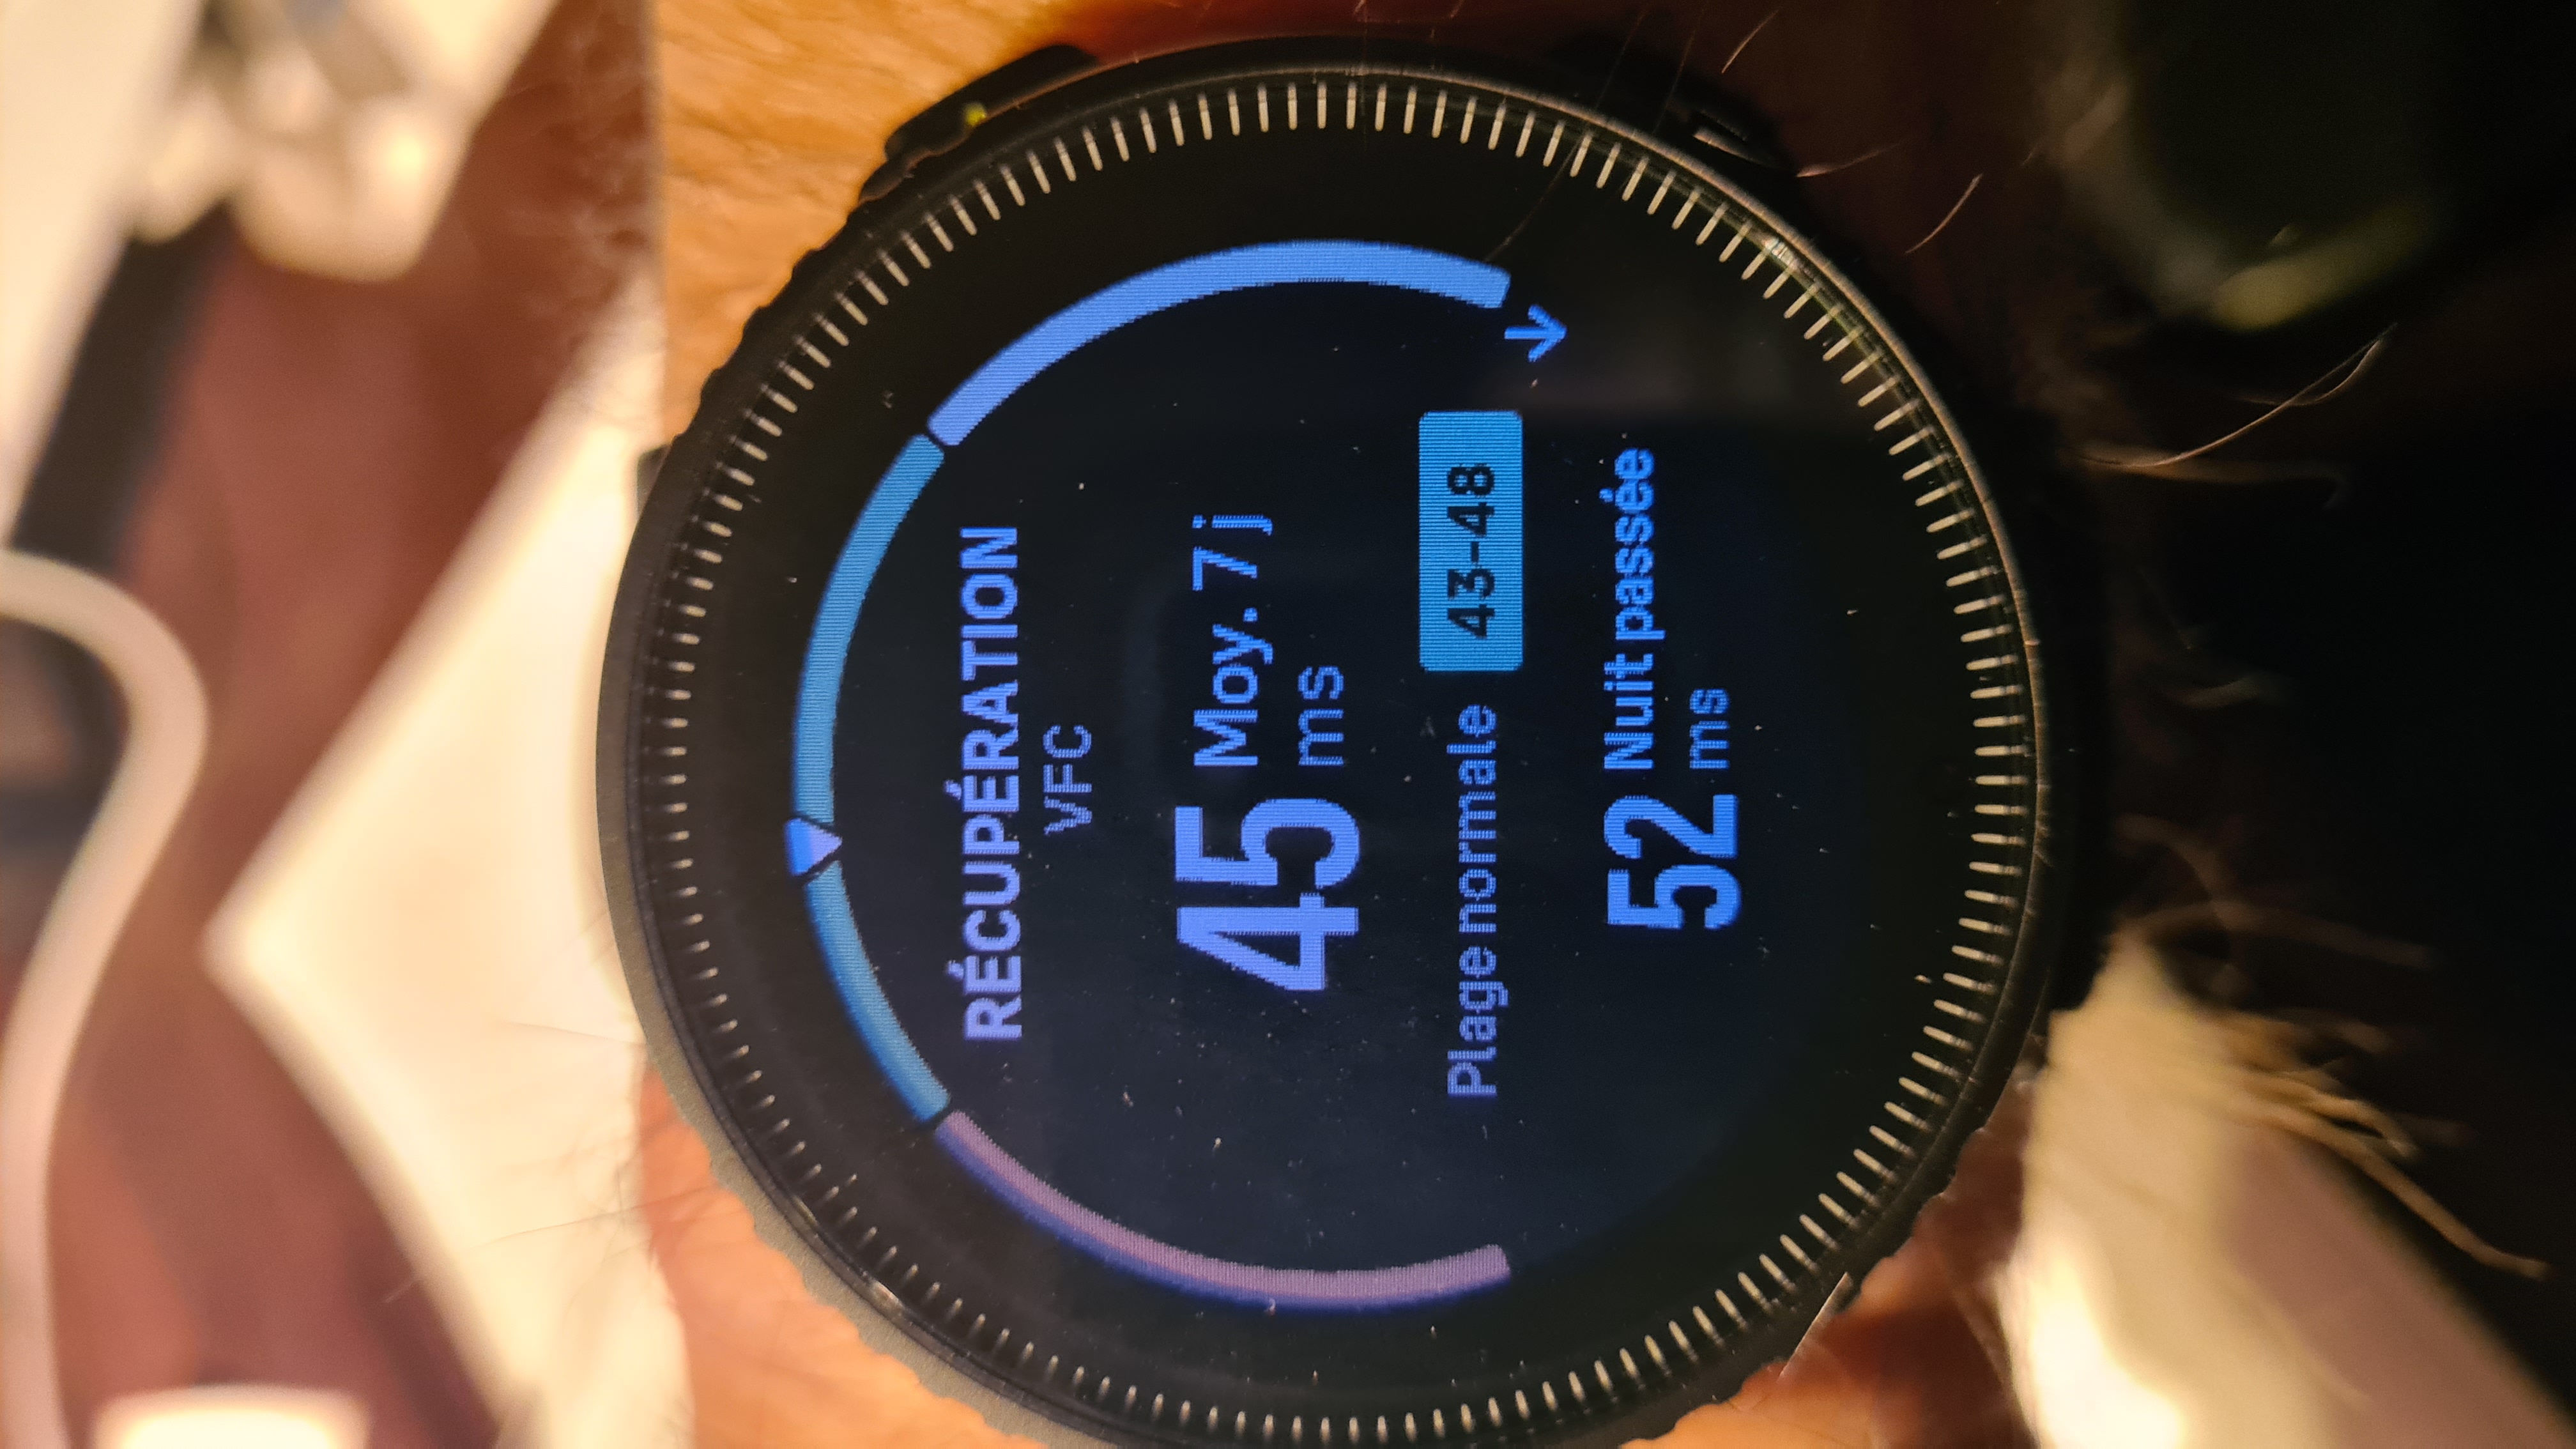
-
@Mff73
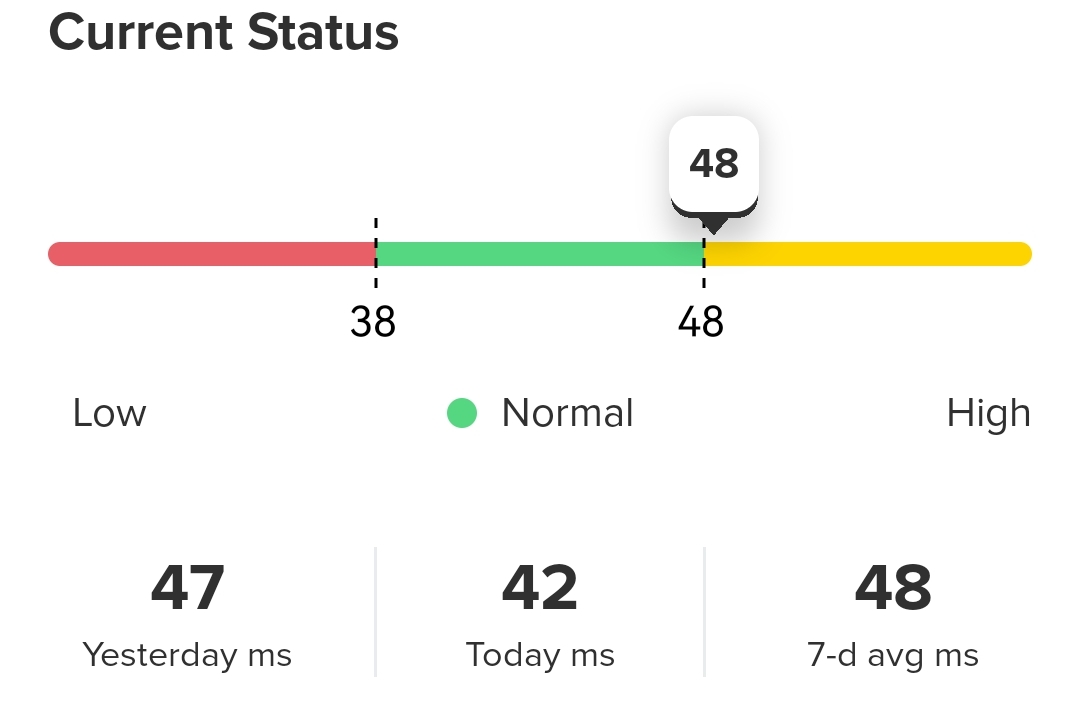
I think my watch and app are consider tally.
Normal range : App show 38 - 48. Watch show 37 - 48.
7-day avg : App show 48. Watch show 47.I guess 1 point different is due to decimal roundup issue.
-
@babychai said in HRV on Vertical:
I guess 1 point different is due to decimal roundup issue.
surely, not critisizing, just mentionning, in case…
-
@Mff73 yeah, i know. so i guess the difference is not because of timing issue like CTL & TSB but more like decimal issue haha
-
@babychai and if you compare the values in Android and iOS versions of the Suunto App, you will also sometimes see a difference between the Android and iOS apps.
So it does indeed seem like there in general is some inconsistency in how rounding/truncation is handled between watch, Android Suunto App and iOS Suunto App.
-
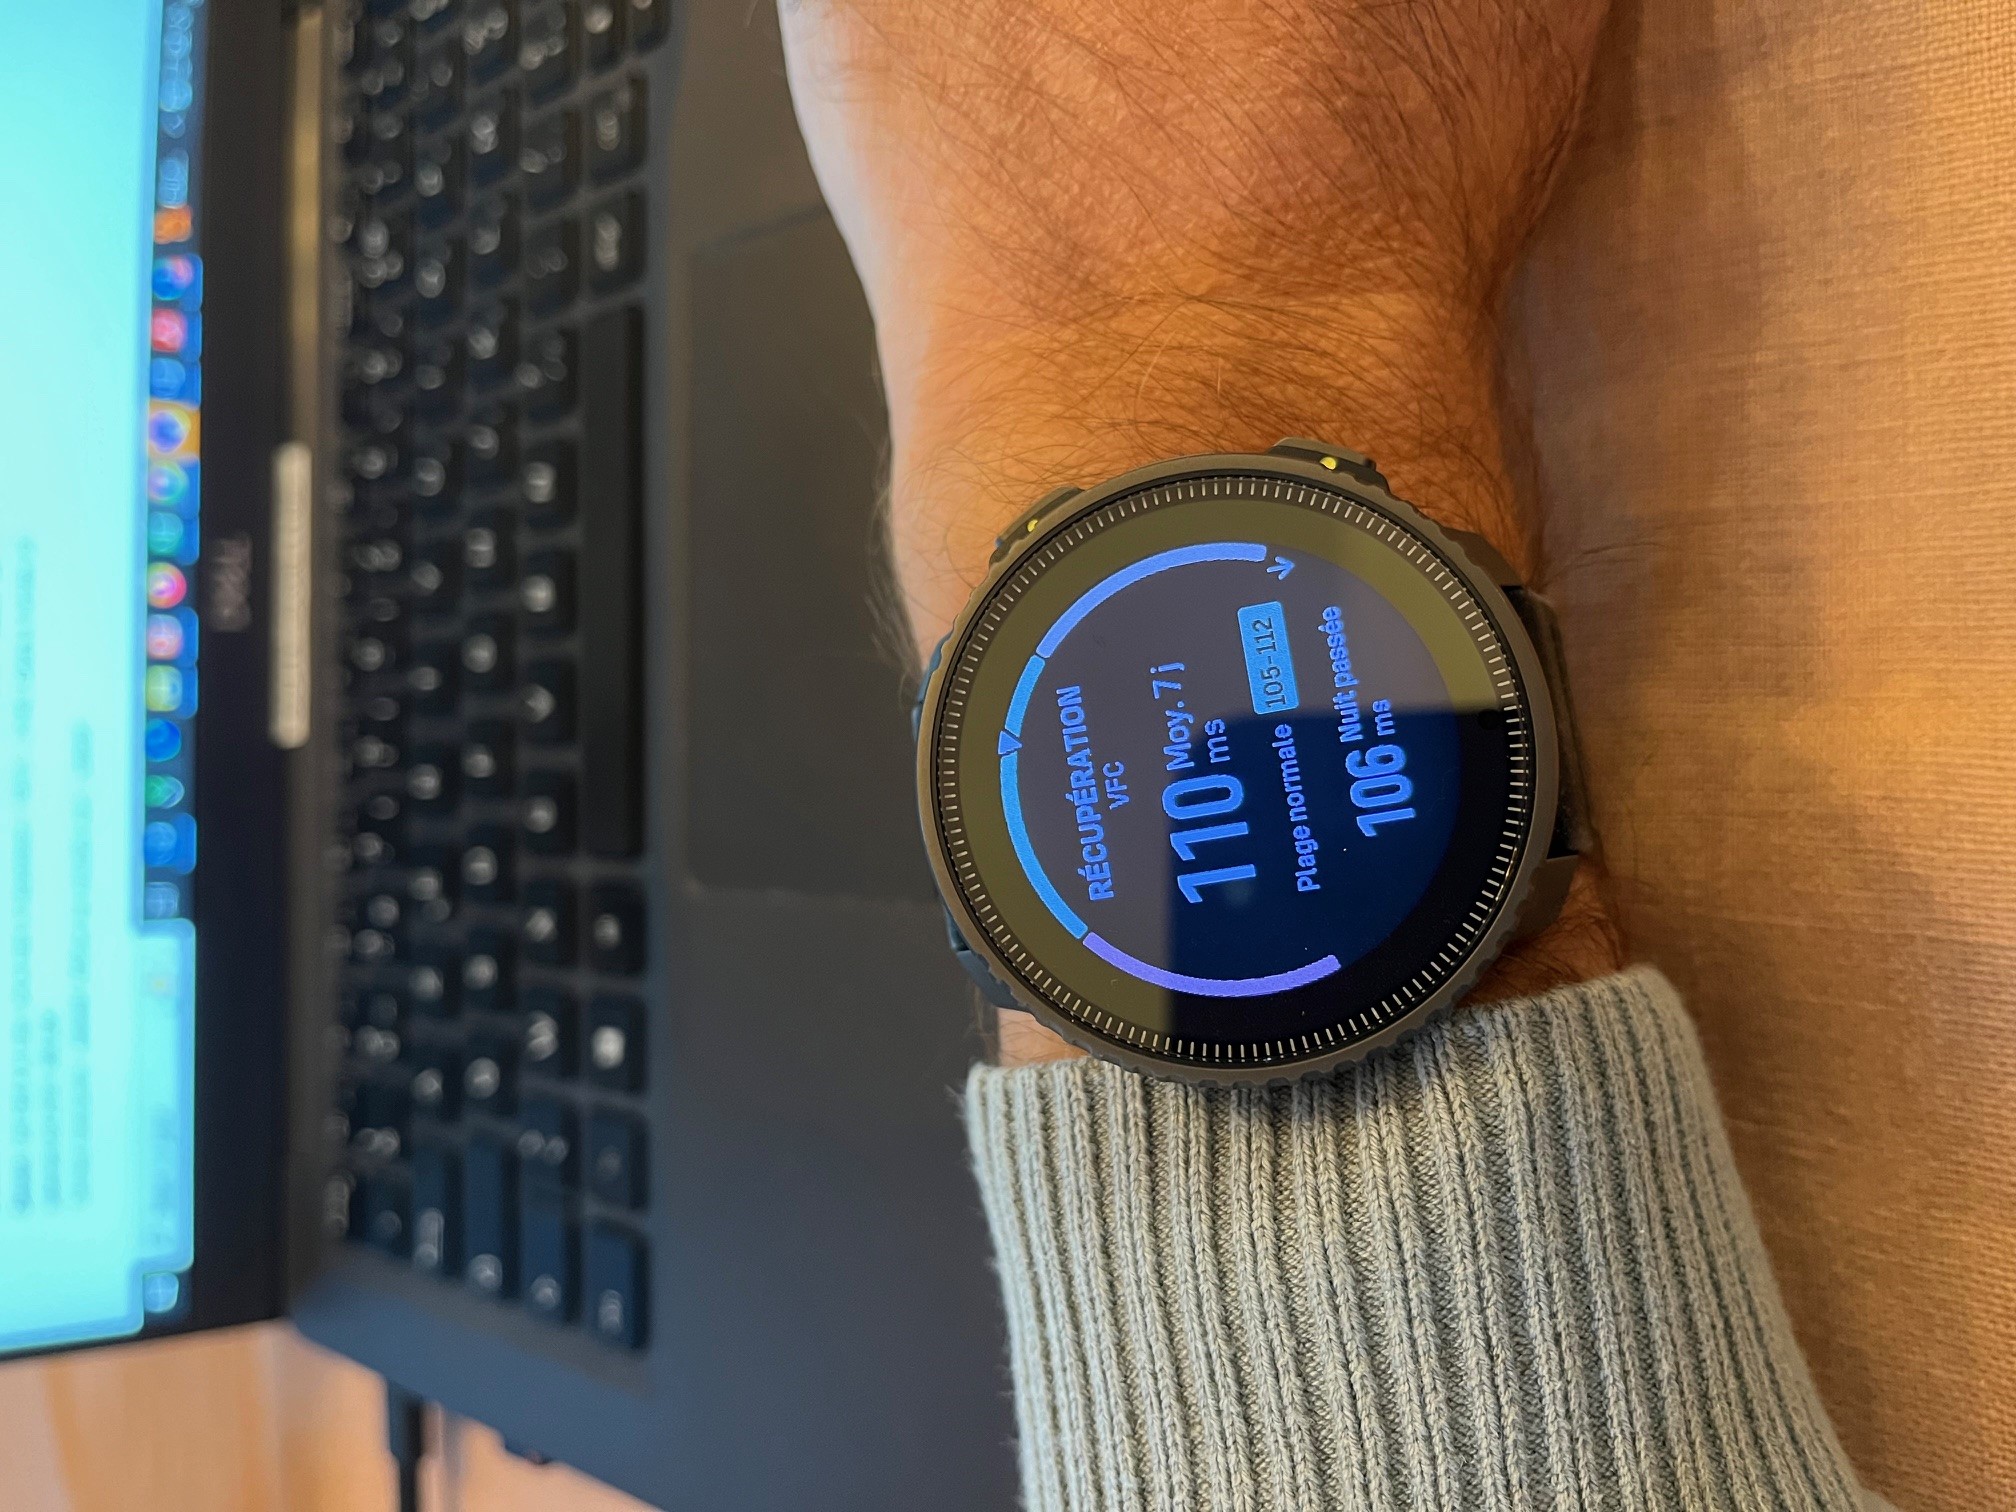
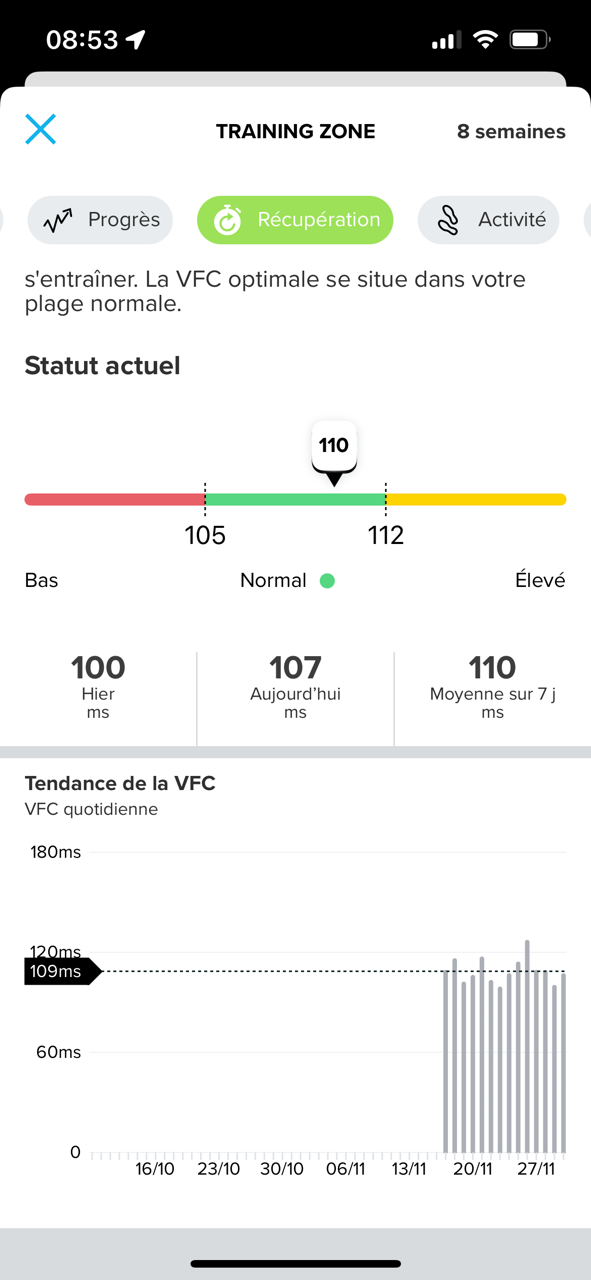
I love the way Suunto uses HRV data. The widget is very visual and easy to understand.
The only hitch is that the data is not exactly the same on the watch and the app.
-
If I understand it well, graph appears just after 14 days. As probably all of us updated watch immediately after the new firmware got out, graph should be available in the same time.

Based on it - with my low numbers - I’m in the normal range. I guess it is because it looks the trends.But I still really curious on why and what means these unnormal low values.
-
@kamarasm said in HRV on Vertical:
But I still really curious on why and what means these unnormal low values.
With just 14 days of history, my personal observation (without any scientific knowledge on it) is that my night average HRV is little lower after a day with training.
-
@Mff73 i feel the same too. my fever also got make HRV drop
-
@babychai said in HRV on Vertical:
@Mff73 i feel the same too. my fever also got make HRV drop
question to experts : shouldn’t it be the opposite ? higher HRV in case of illness ?

-
@Mff73 no. less rest, higher stress on the body resulting in smaller variability.
-
@Mff73 said in HRV on Vertical:
question to experts : shouldn’t it be the opposite ? higher HRV in case of illness ?

Definitely not an expert, but I believe your system is more stressed during illness, so the sympathetic system takes over resulting in lower HRV. When healthy and relaxed, the parasympathetic system is dominant and HRV increases.
-
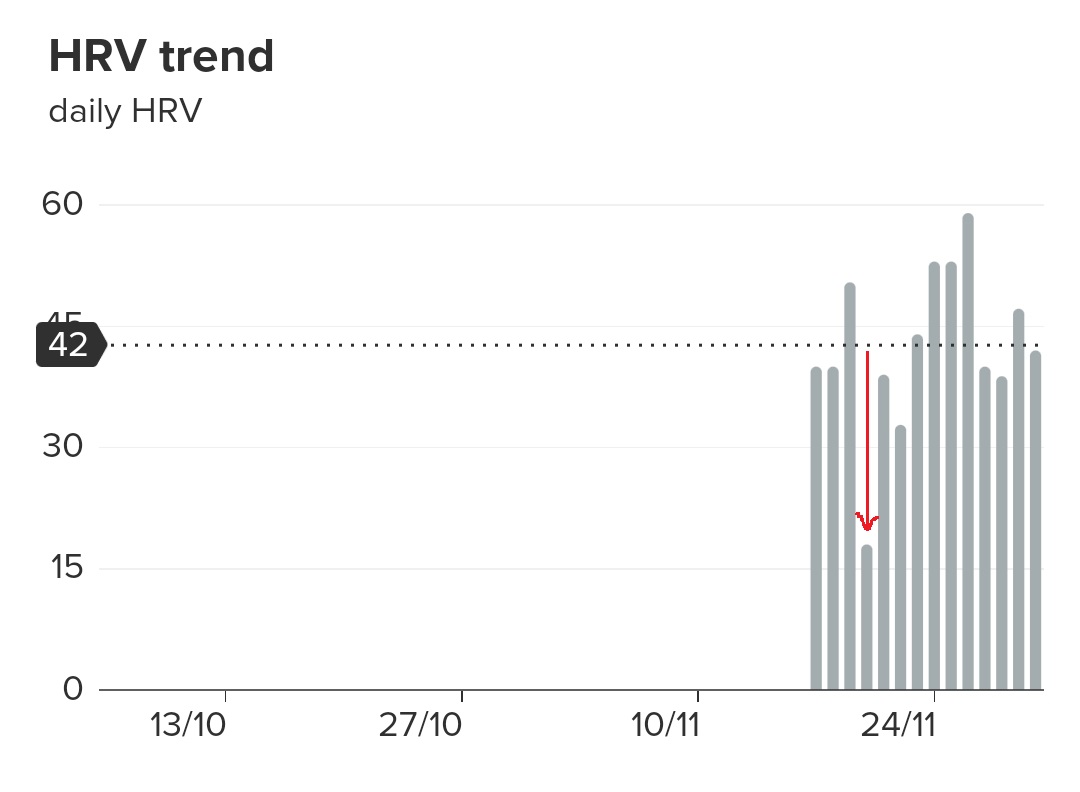
actually when i got fever my HRV drop a lot. dropped to 18. normal day my lowest is 33. so quite big different actually.
-
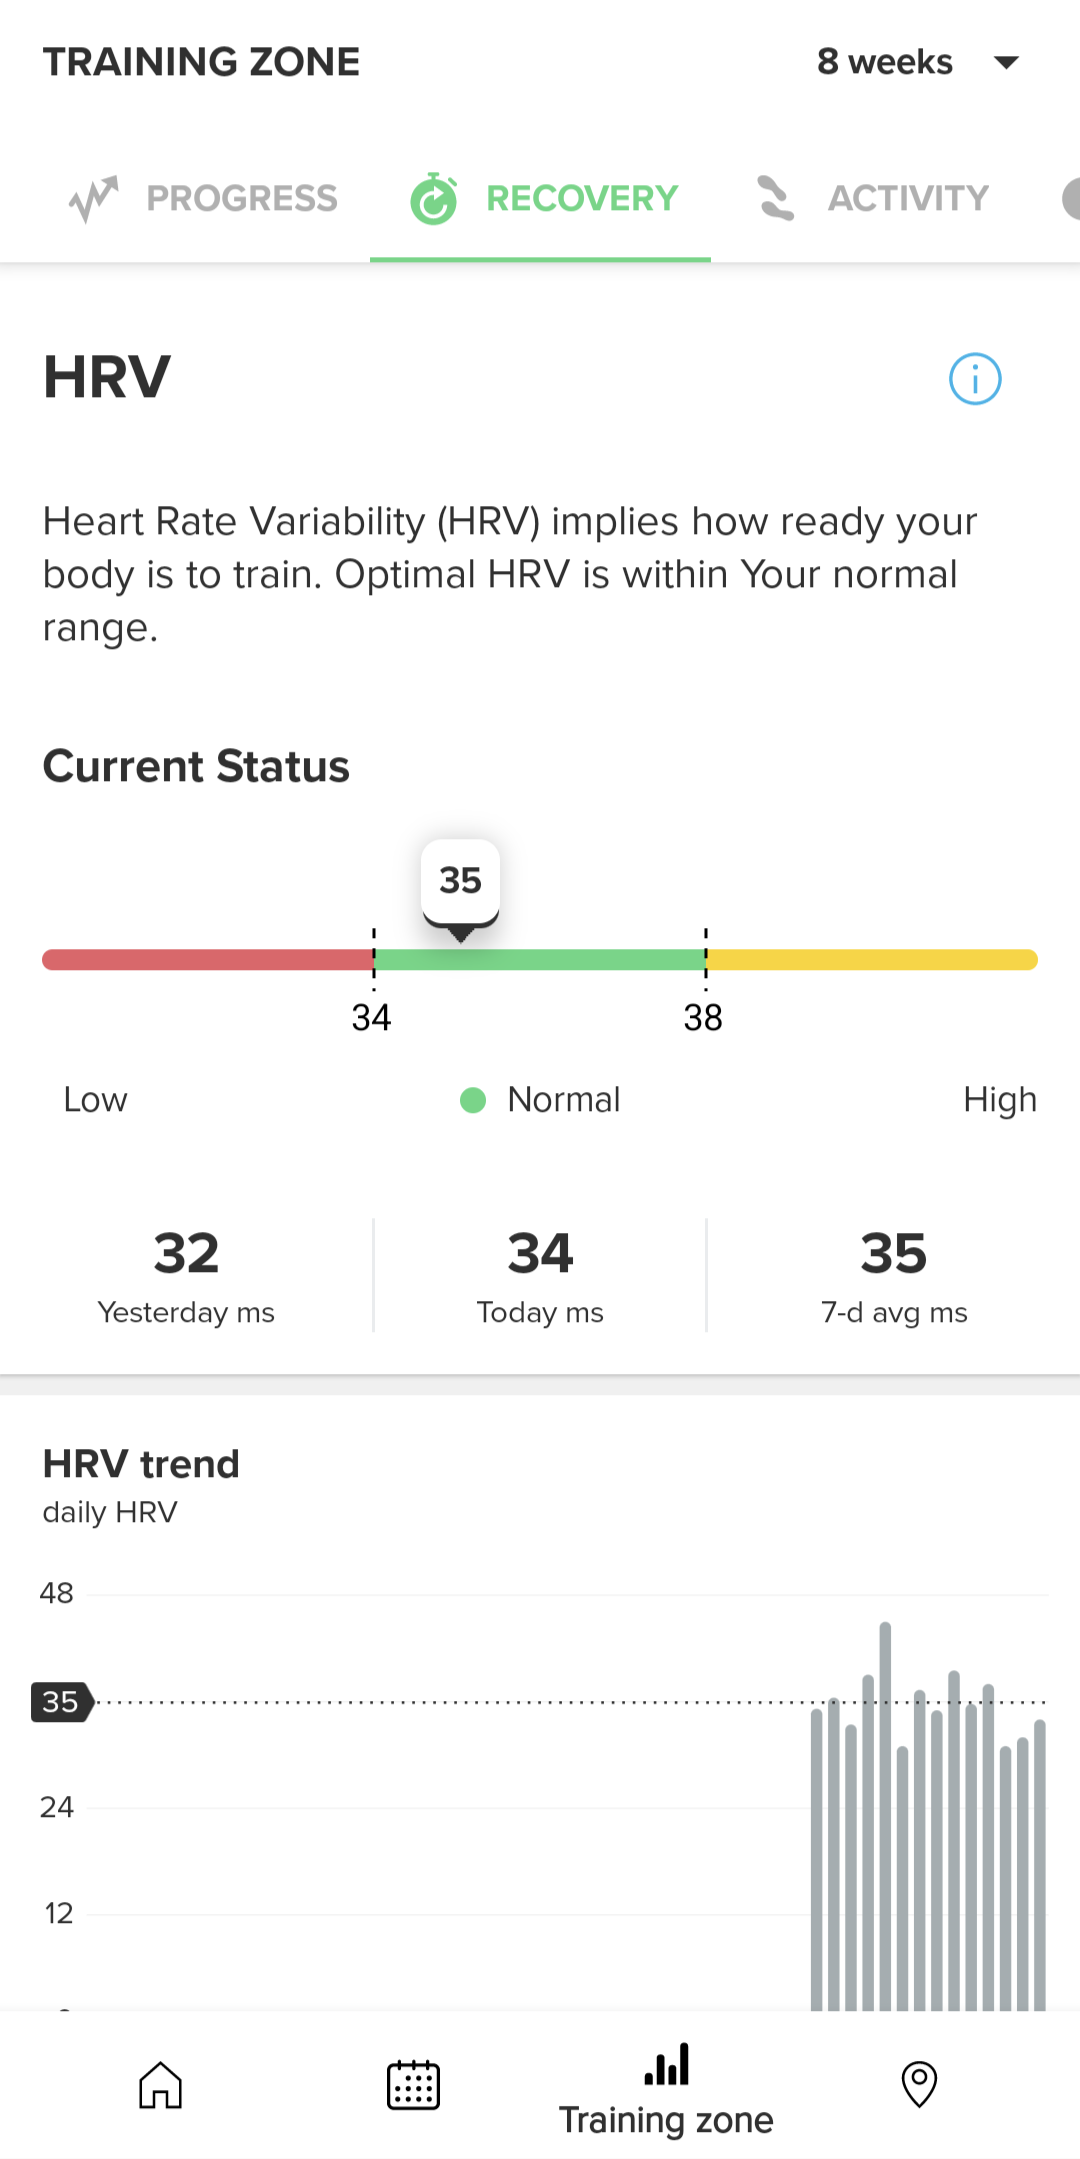
Mine is 30 something where is the chart about hrv and age?
-
@babychai Pretty cool how it reaffirms your health like that! I had similar results where I got busy at work and run down and my HRV trended with how I was feeling. Pretty good indicator to take it easy or know that we are coming down with something!
-
@Kai-Liu Here is a write up on HRV for age, sex etc.
https://the5krunner.com/2016/09/16/hrv-how-good-is-your-hrv-and-does-it-matter/Also
https://welltory.com/the-12-mistakes-when-measuring-hrv/