-
@RiphRaph if your watch didn’t have that filter it would produce unrealistic ascent’s.
Could I have a comparison of your prev tomrom with the Spartan to understand ?
-
@RiphRaph different watches have different algorithms, and you’ll see people complain a lot about elevation on other vendor’s forums too.
-
@TELE-HO The offset is about as big on other routes as well. Just checked my other regular loop and the Suunto claims about 25% of the ascent that the Tomtom reported. I guess I will be looking out for a baro watch, because this is just nuts.
-
@Dimitrios-Kanellopoulos It produces unrealistic ascents with the filter as well. QED.

Do you mean you want to see actual gpx files? I can provide those, but not via links in a post here as I don’t want to disclose location info on a public forum. Can I send them to you privately on this forum? I’m not yet very conversant with how things work around here.
-
@RiphRaph said in Dodgy elevation on Spartan Sport WHR:
Send me a chat message pleaseYou can upload them to dropbox / drive and pass me the link
-
@Dimitrios-Kanellopoulos OK, just did that.
-
roger that
-
@Dimitrios-Kanellopoulos even with baro it looks weird when I see my data in QS.
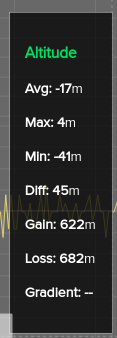
Elevation gain/loss is over 600 meters:

But the watch says:

Is Ascent/Descent same here as total elevation gain/loss. My understanding is that the Ascent/Descent are totals from whole activity:

The altitude uses baro only here (no GPS, it’s indoor, it’s always either going up or down without GPS).
@RiphRaph I think my issue may be related/similar but if not then sorry, I didn’t mean to hijack your thread

-
@jsr184 QS uses the minimal 1m calculation for charts. You can edit this on settings.
Your hand moves more than 1m FYI its logical. That is the case why all companies use filters. See my reply above
-
@Dimitrios-Kanellopoulos “the diff is so small”?
On the 8 km route, Tomtom reports 68 m of ascent and the Spartan reports 22.
On the 10 km route, Tomtom reports 86 m and Spartan reports 14.In what world is this a “small” difference?
-
@RiphRaph I am sorry. I read 44 vs 52 as seen in the pics.
-
@Dimitrios-Kanellopoulos is 1m means meter or minute?
 Don’t get angry please, but I don’t think I understood what you’ve been trying to say
  The thing is that if I do a climb of 9-10 meters up and then I’m being belayed down it’s usually 2-3 minutes of staying pretty much in the same location in 2D floor space. Hence, what QS shows looks more real. I don’t believe that my total ascent registered by Spartan was just little over 100m while I spent in the climbing centre over 8 hours doing just that - climbing (average route 7-10m high). Is it possible that my higher climbs are filtered by Suunto because it assumes no one suddenly can shot up in the air so far in such a small area?
  622m vs 111m is even greater difference.
 -
@Dimitrios-Kanellopoulos
all the tiny spikes in @jsr184 's recording could also be sealed sensor holes and pumping effect… -
@RiphRaph and yes I could say it’s small 30m of a miss. But that is personal and debatable.
But to be fair the tom tom has an external antenna and it’s accuracy is well comperable to an Ambit according to many AFAIK
If you are really that concerned about ascent in these small scales you should go for a baro device.
Again and honestly from an ascent freak, anything under 100m up and down “is flat” but that is very “bad” from me to say.

-
@Dimitrios-Kanellopoulos said in Dodgy elevation on Spartan Sport WHR:
anything under 100m up and down “is flat”
yes it is

-
@jsr184 1meter, I am not angry just not putting emoticons. lol.
I am just replying fast.
If you want QS to show you a better ascent I would go to settings and put that filter to 3-4m.
4m is the ideal for all devices. That is not something from the top of my head. More news will come later as I am collaborating with some people and we train neural networks (for QS) and we are trying to publish those results, provide you this clevernes and GAP
 (on QS).
 -
@TELE-HO tiny spikes are climbs on the wall :). It’s second half after break (you can see break as almost flat line). The first part is just bouldering with ascents of 3-5 meters (more frequent hence spikes). Except of the lowering altitude over time trend (which seems to be normal with baro) this graph looks pretty much ok.
-
@TELE-HO the 1%

-
-
@Dimitrios-Kanellopoulos Wow. I guess we’re well into bizarro world if a deviation of anything up to 100 m is considered acceptable!


