Disappointed by altitude, using the R2 barometer
-
Hello dear fellow Suunto-ers.
As I’m not super happy with the altitude reporting in my Race 2, I just wanted to know whether I’m the only one feeling that the numbers don’t make any sense and if so, whether you have some tips to improve it (in the setup) or if there’s any way to use the altitude obtained from the GPS position, rather than using the built-in barometer.
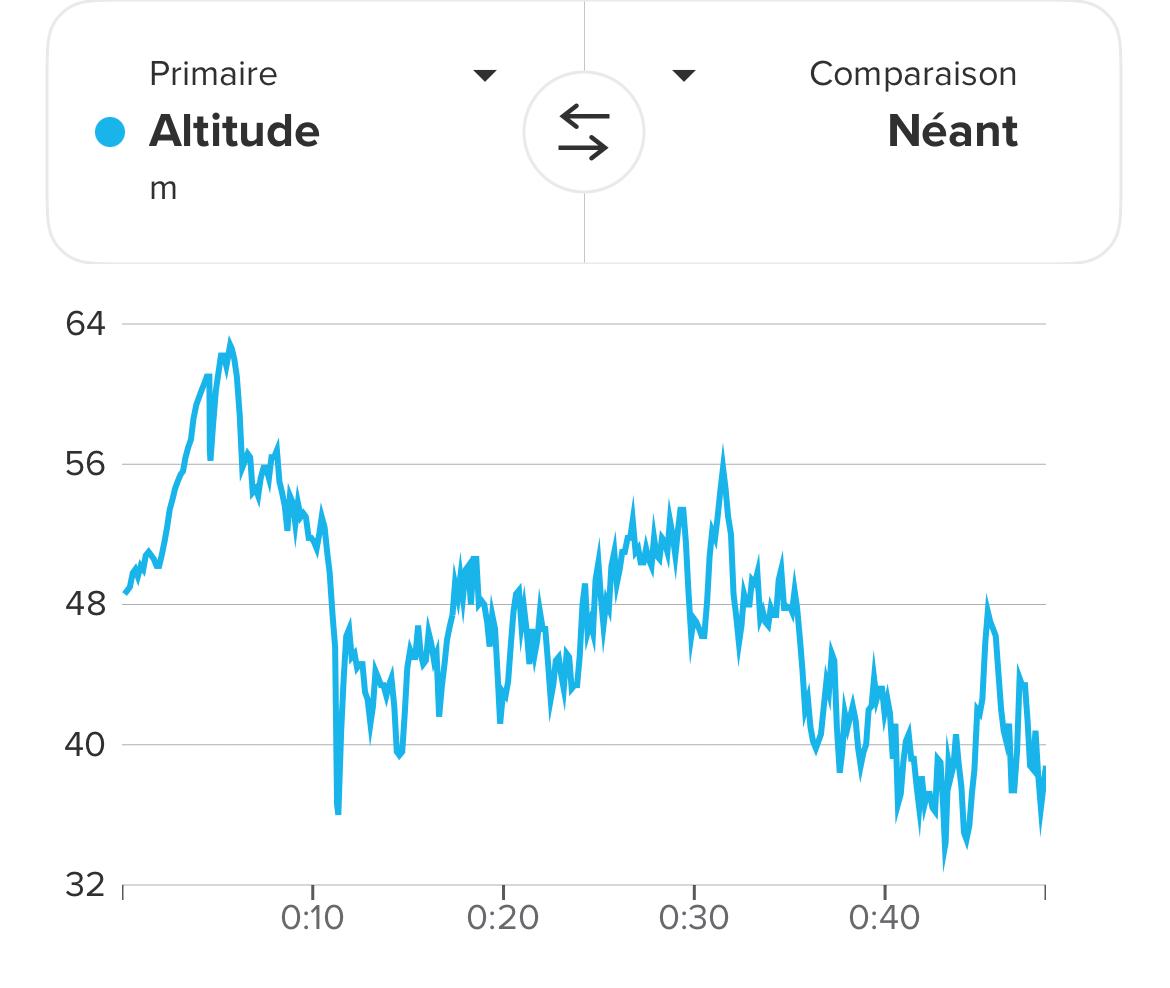
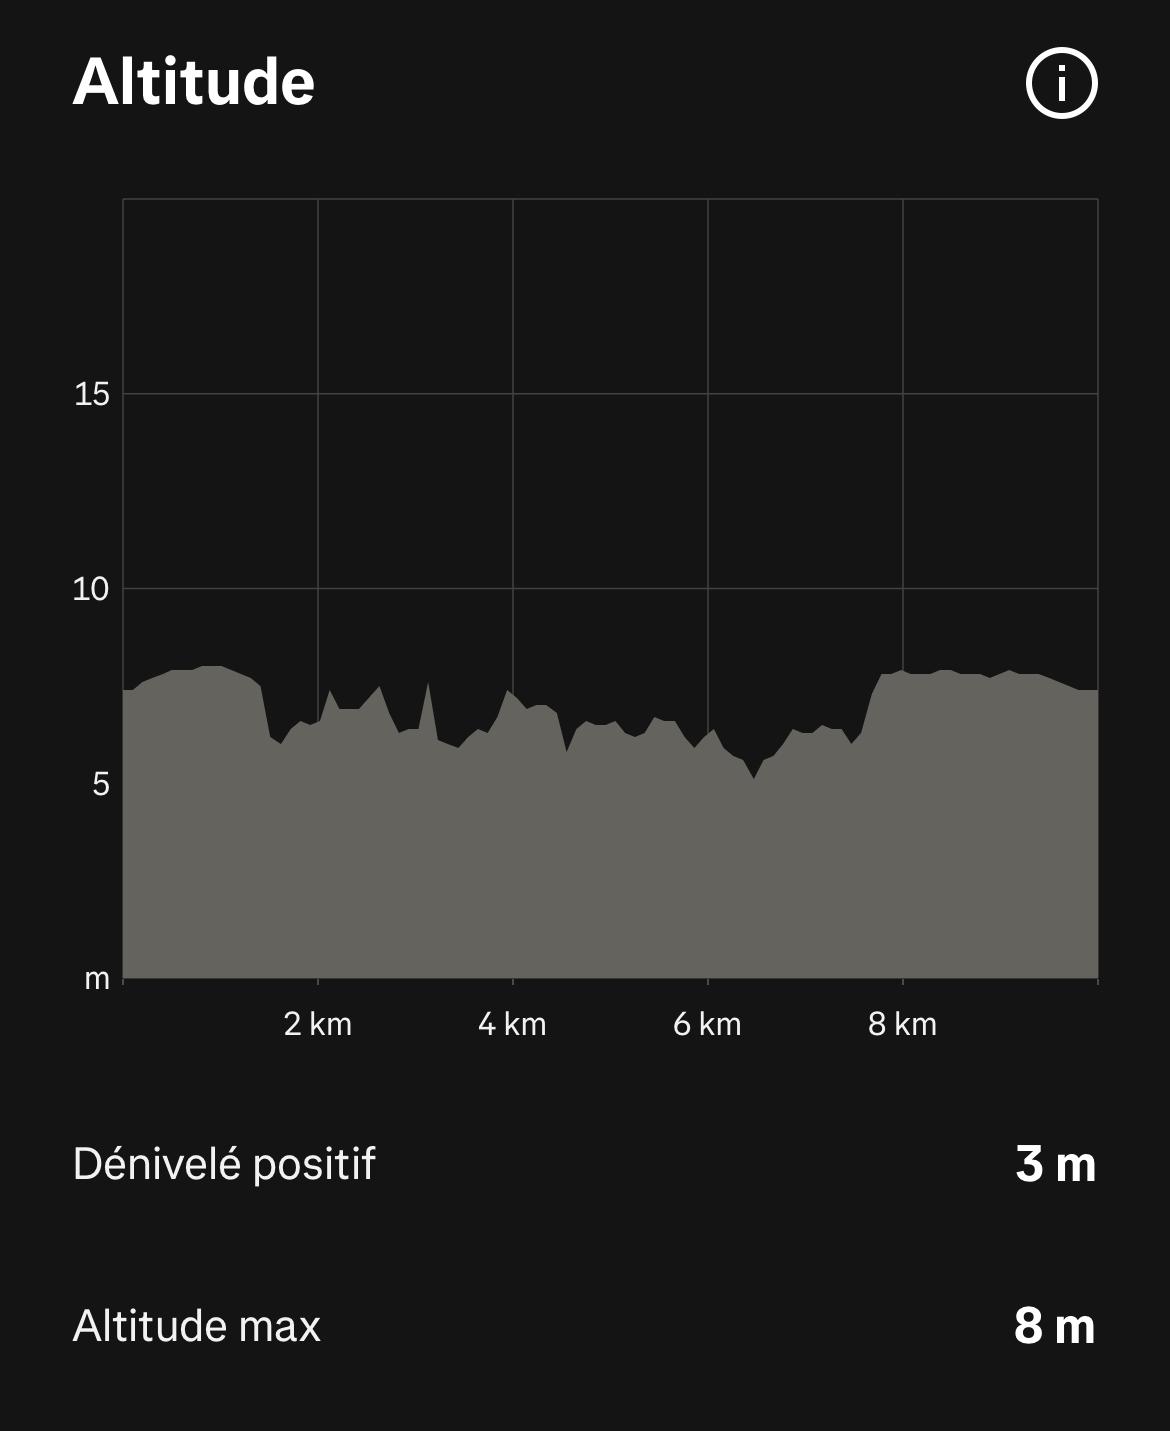
In one of my lastest runs, which was completed on a race at sea-level, with the first 500 meters and the last 2.5K on a road next to the sea, My R2’s (barometer) recorded a total ascent of 179 meters and a total descent of 174 meters by the end of the race, with a highest point of 63 meters and a lowest point of 34 meters. However, when I compare this with the data on Strava, the elevation ranges only from 5 meters to 8 meters, which makes total sense, again considering I was running at sea leavel.
Another thing that makes me question the accuracy of the data is that the start and finish were at exactly the same location. In other words, the first 500 meters of the race were exactly the same as the last 500 meters. Yet, when I look at the elevation profile in the Suunto app, it shows that I ran the first 500 meters on a slope rising from 48 meters to 63 meters. But on that very same section of the course—this time during the last 500 meters before the finish—the elevation profile rises from 35 meters to 38 meters, with a peak at 48 meters.
Suunto graph:
Strava graph (leveraging GPS instead of barometer):
Any feedback welcome!
PS: I tried to look for an existing topic, but couldn’t really find something 100% similar. Moderators, feel free to move this post to any relevant topic

Hello! It looks like you're interested in this conversation, but you don't have an account yet.
Getting fed up of having to scroll through the same posts each visit? When you register for an account, you'll always come back to exactly where you were before, and choose to be notified of new replies (either via email, or push notification). You'll also be able to save bookmarks and upvote posts to show your appreciation to other community members.
With your input, this post could be even better 💗
Register Login