No more weather in my location (City) it shows district now.
-
@Jonathan-C
for my part I am on Android. So maybe linked to the app Suunto -
@yome77 @Jonathan-C Ocean on the left paired to iOS shows city (no idea where Waverly is!), and Race on the right shows county, paired to Android.
And there I was thinking it was a cost-saving measure: poll a larger area for weather, query the API less (OpenWeather?), incur fewer charges. Or perhaps it is, and that change hasn’t reached iOS yet…
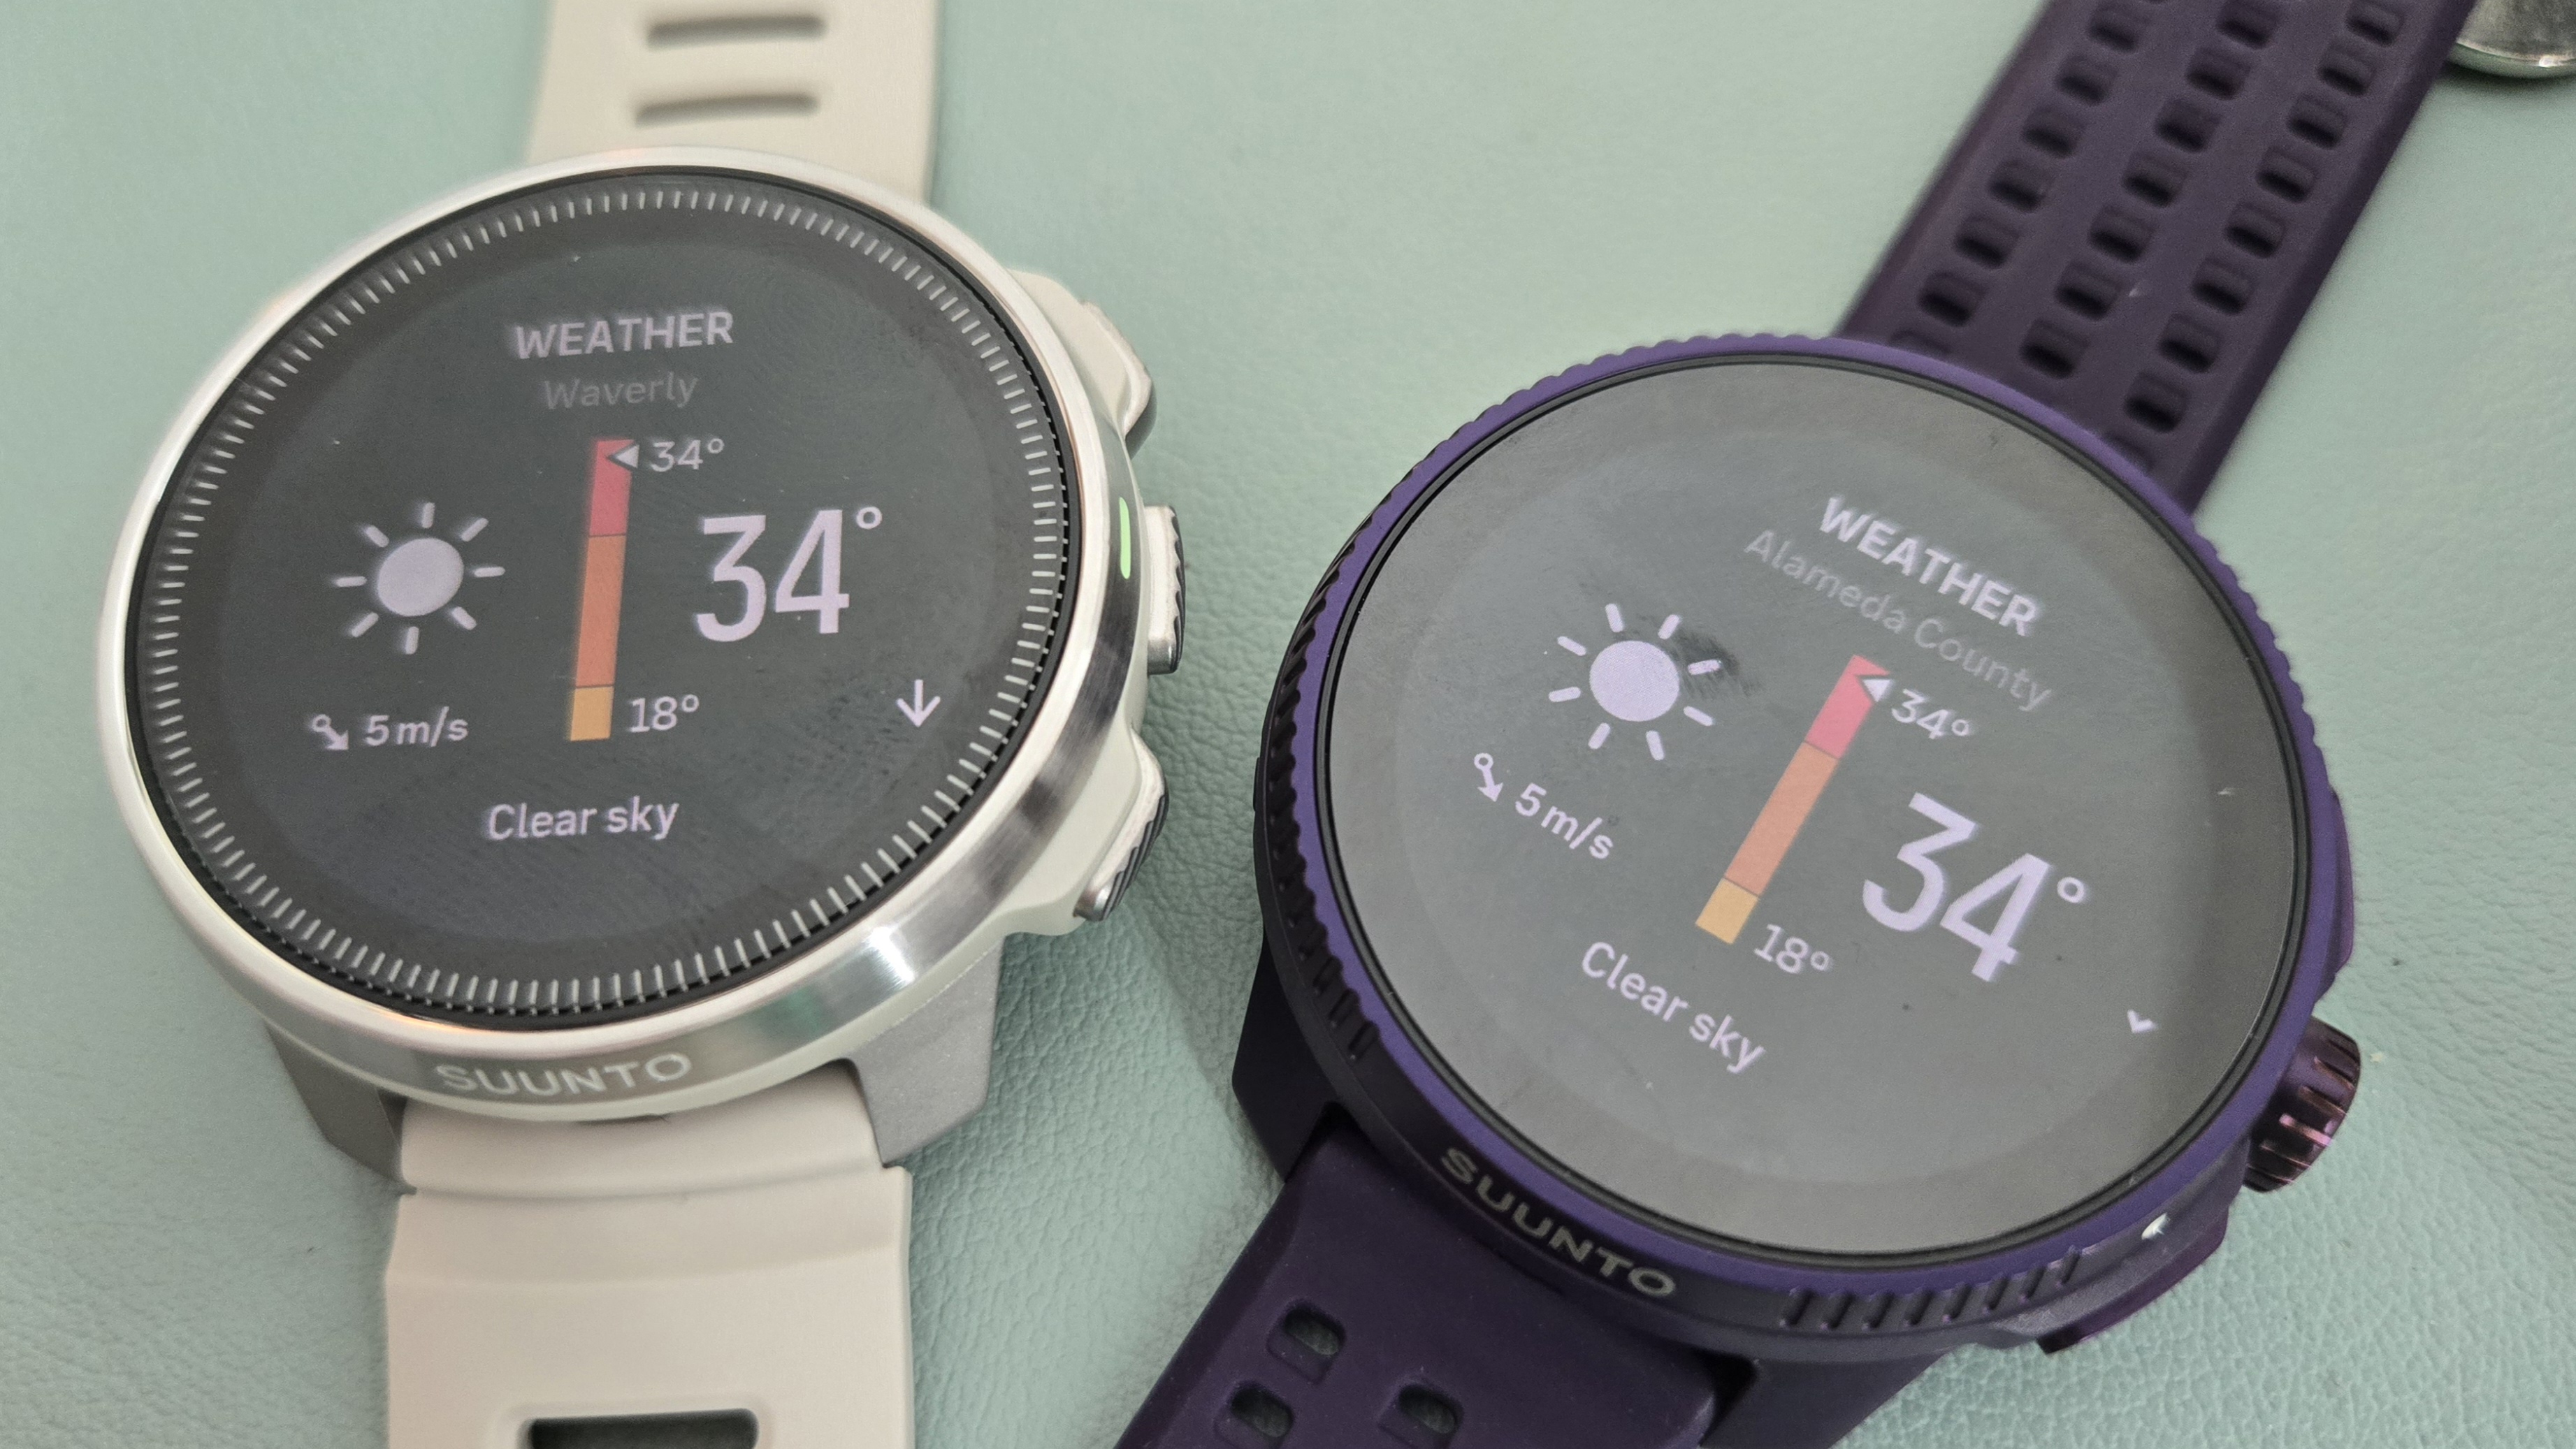
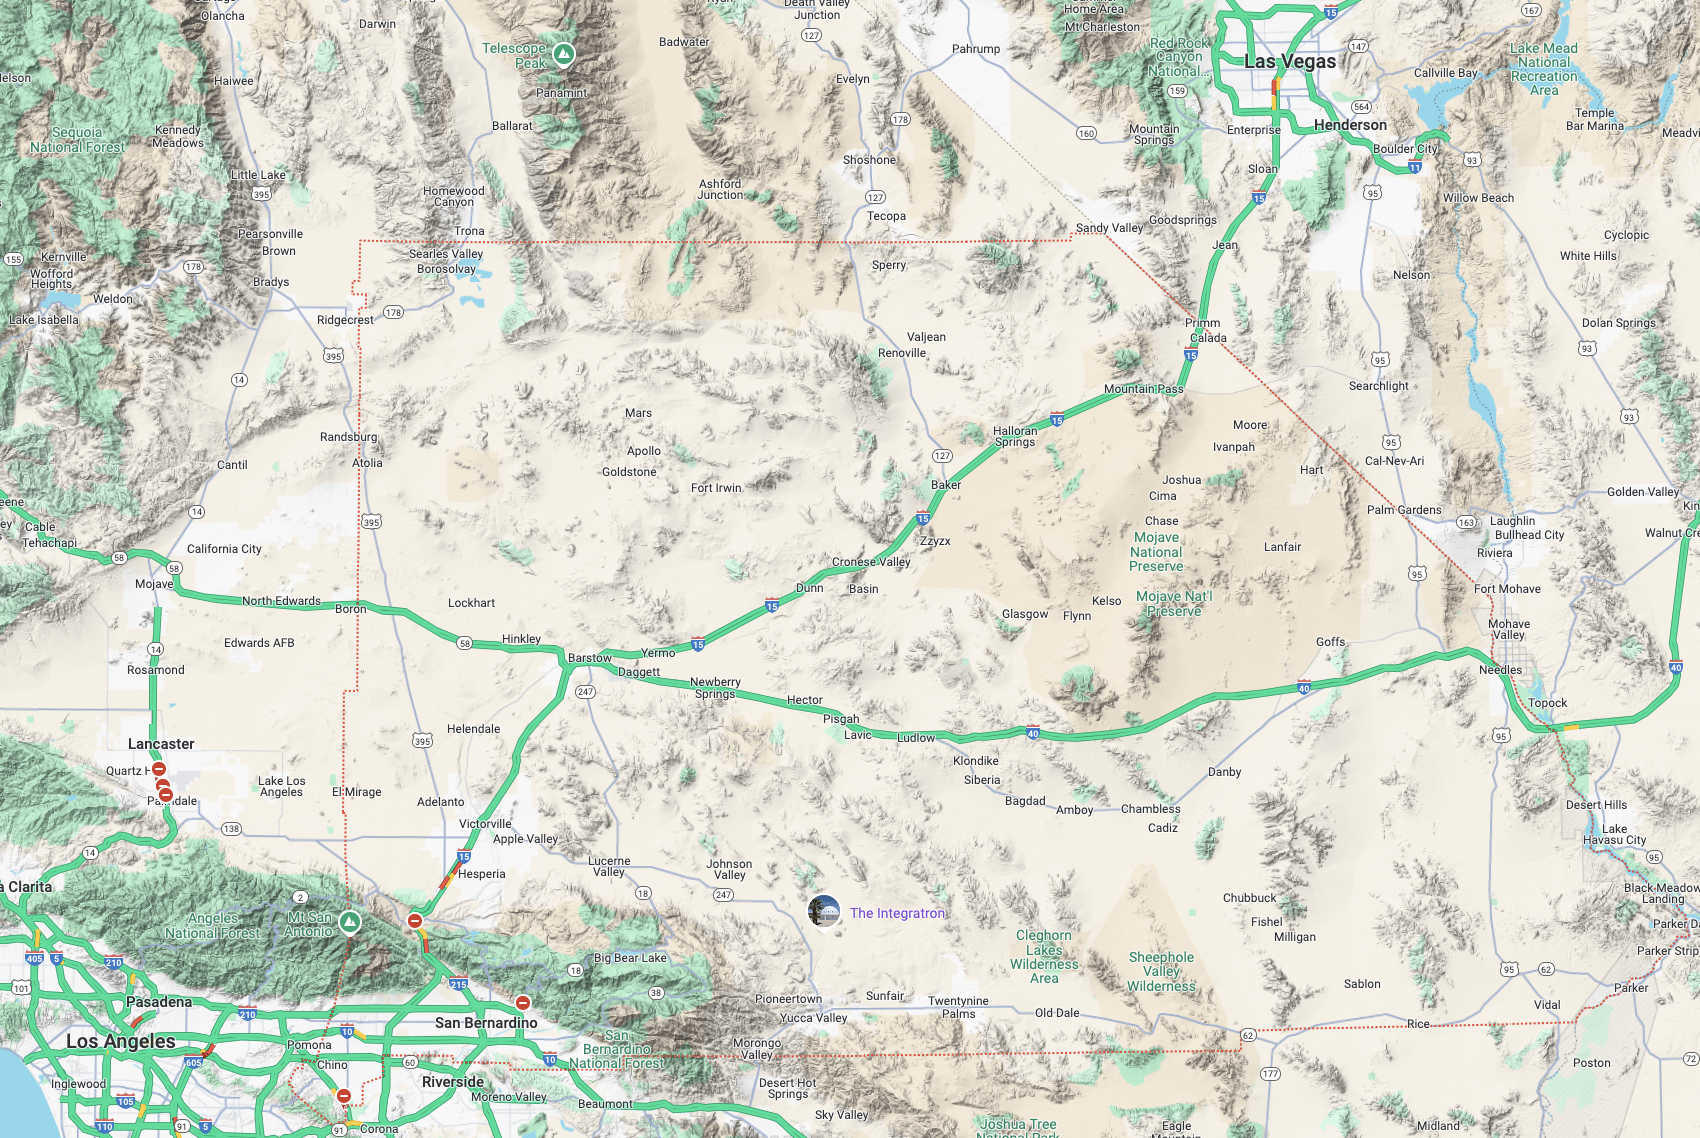
Edit: I looked up the area for Waverly on GMaps, see below, that’ll mean one API query will get weather for me, I don’t imagine there are any other Suunto users in that tiny grid.
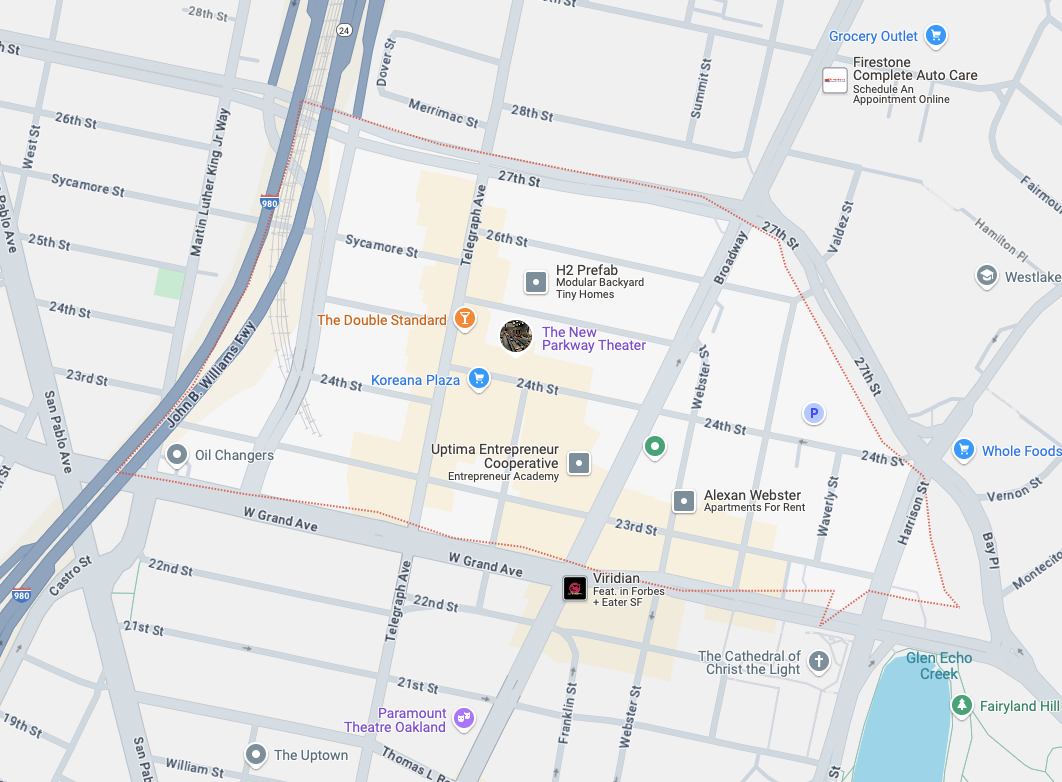
Alameda Country, for comparison, is huge, so one API query can probably serve many Suunto users. Imagine this for somewhere like London. (I added the current temperature to both areas to illustrate my point after the image).
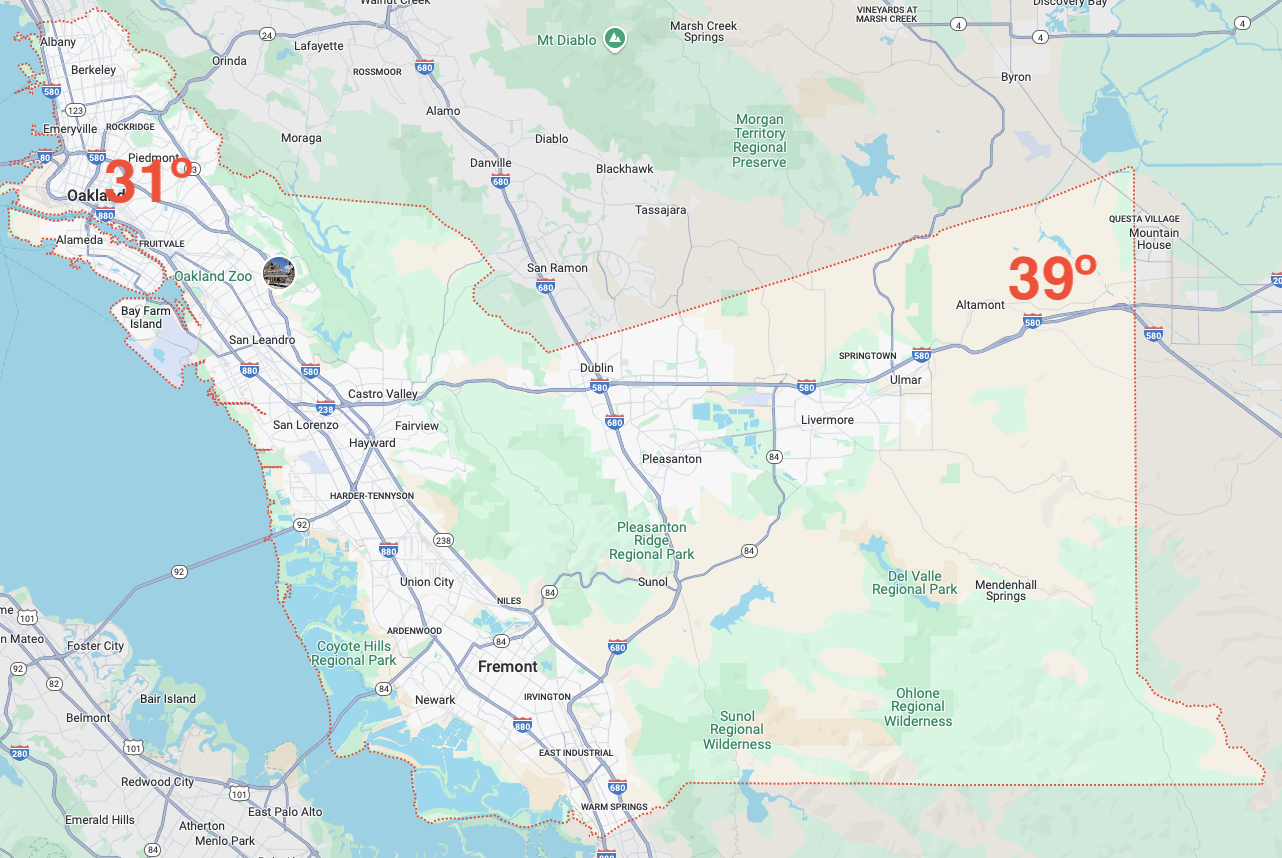
It’s also pretty annoying, as at least in Alameda country, it’s forecast to be 39ºC in the far east, inland, and 31ºC where I am. I’d plan differently for those two extremes, specifically I would exercise at 31º, but at 39º I’d not exercise. There’s also a very wide range in air quality from where I am: near-coastal, often a strong offshore breeze blowing pollution inland, east, so while I might choose to exercise with my area’s air quality on a given day, I probably wouldn’t more inland (check out a pollution map for the Bay Area: more often than not we lucky coastal dwellers have good air quality, where as those east of us get our pollution.
For those saying ‘just go outside and see how hot it is’, I’m in the habit of looking at the hourly forecast on my watch to plan when to exercise, which, at least when paired to Android, is now an average of an area 2128.9km².
Consider me irked by this silent change: I think a sensible compromise would be at the city level, but county is too much.
PS…: the average size of a county in the US is 3168km² so county is definitely not a useful. For the UK it’s 620km², Germany 891km² and Finland 1095km².
-
@Ze-Stuart thanks for the excellent write up!
I echo your thoughts completely because there is a similar problem here: I happen to be in one of two US states where county government had long been abolished, and practically means nothing.
In the Northeast we go by towns and localized weather used to work very well with these tiny geographic entities that have defined boundaries.
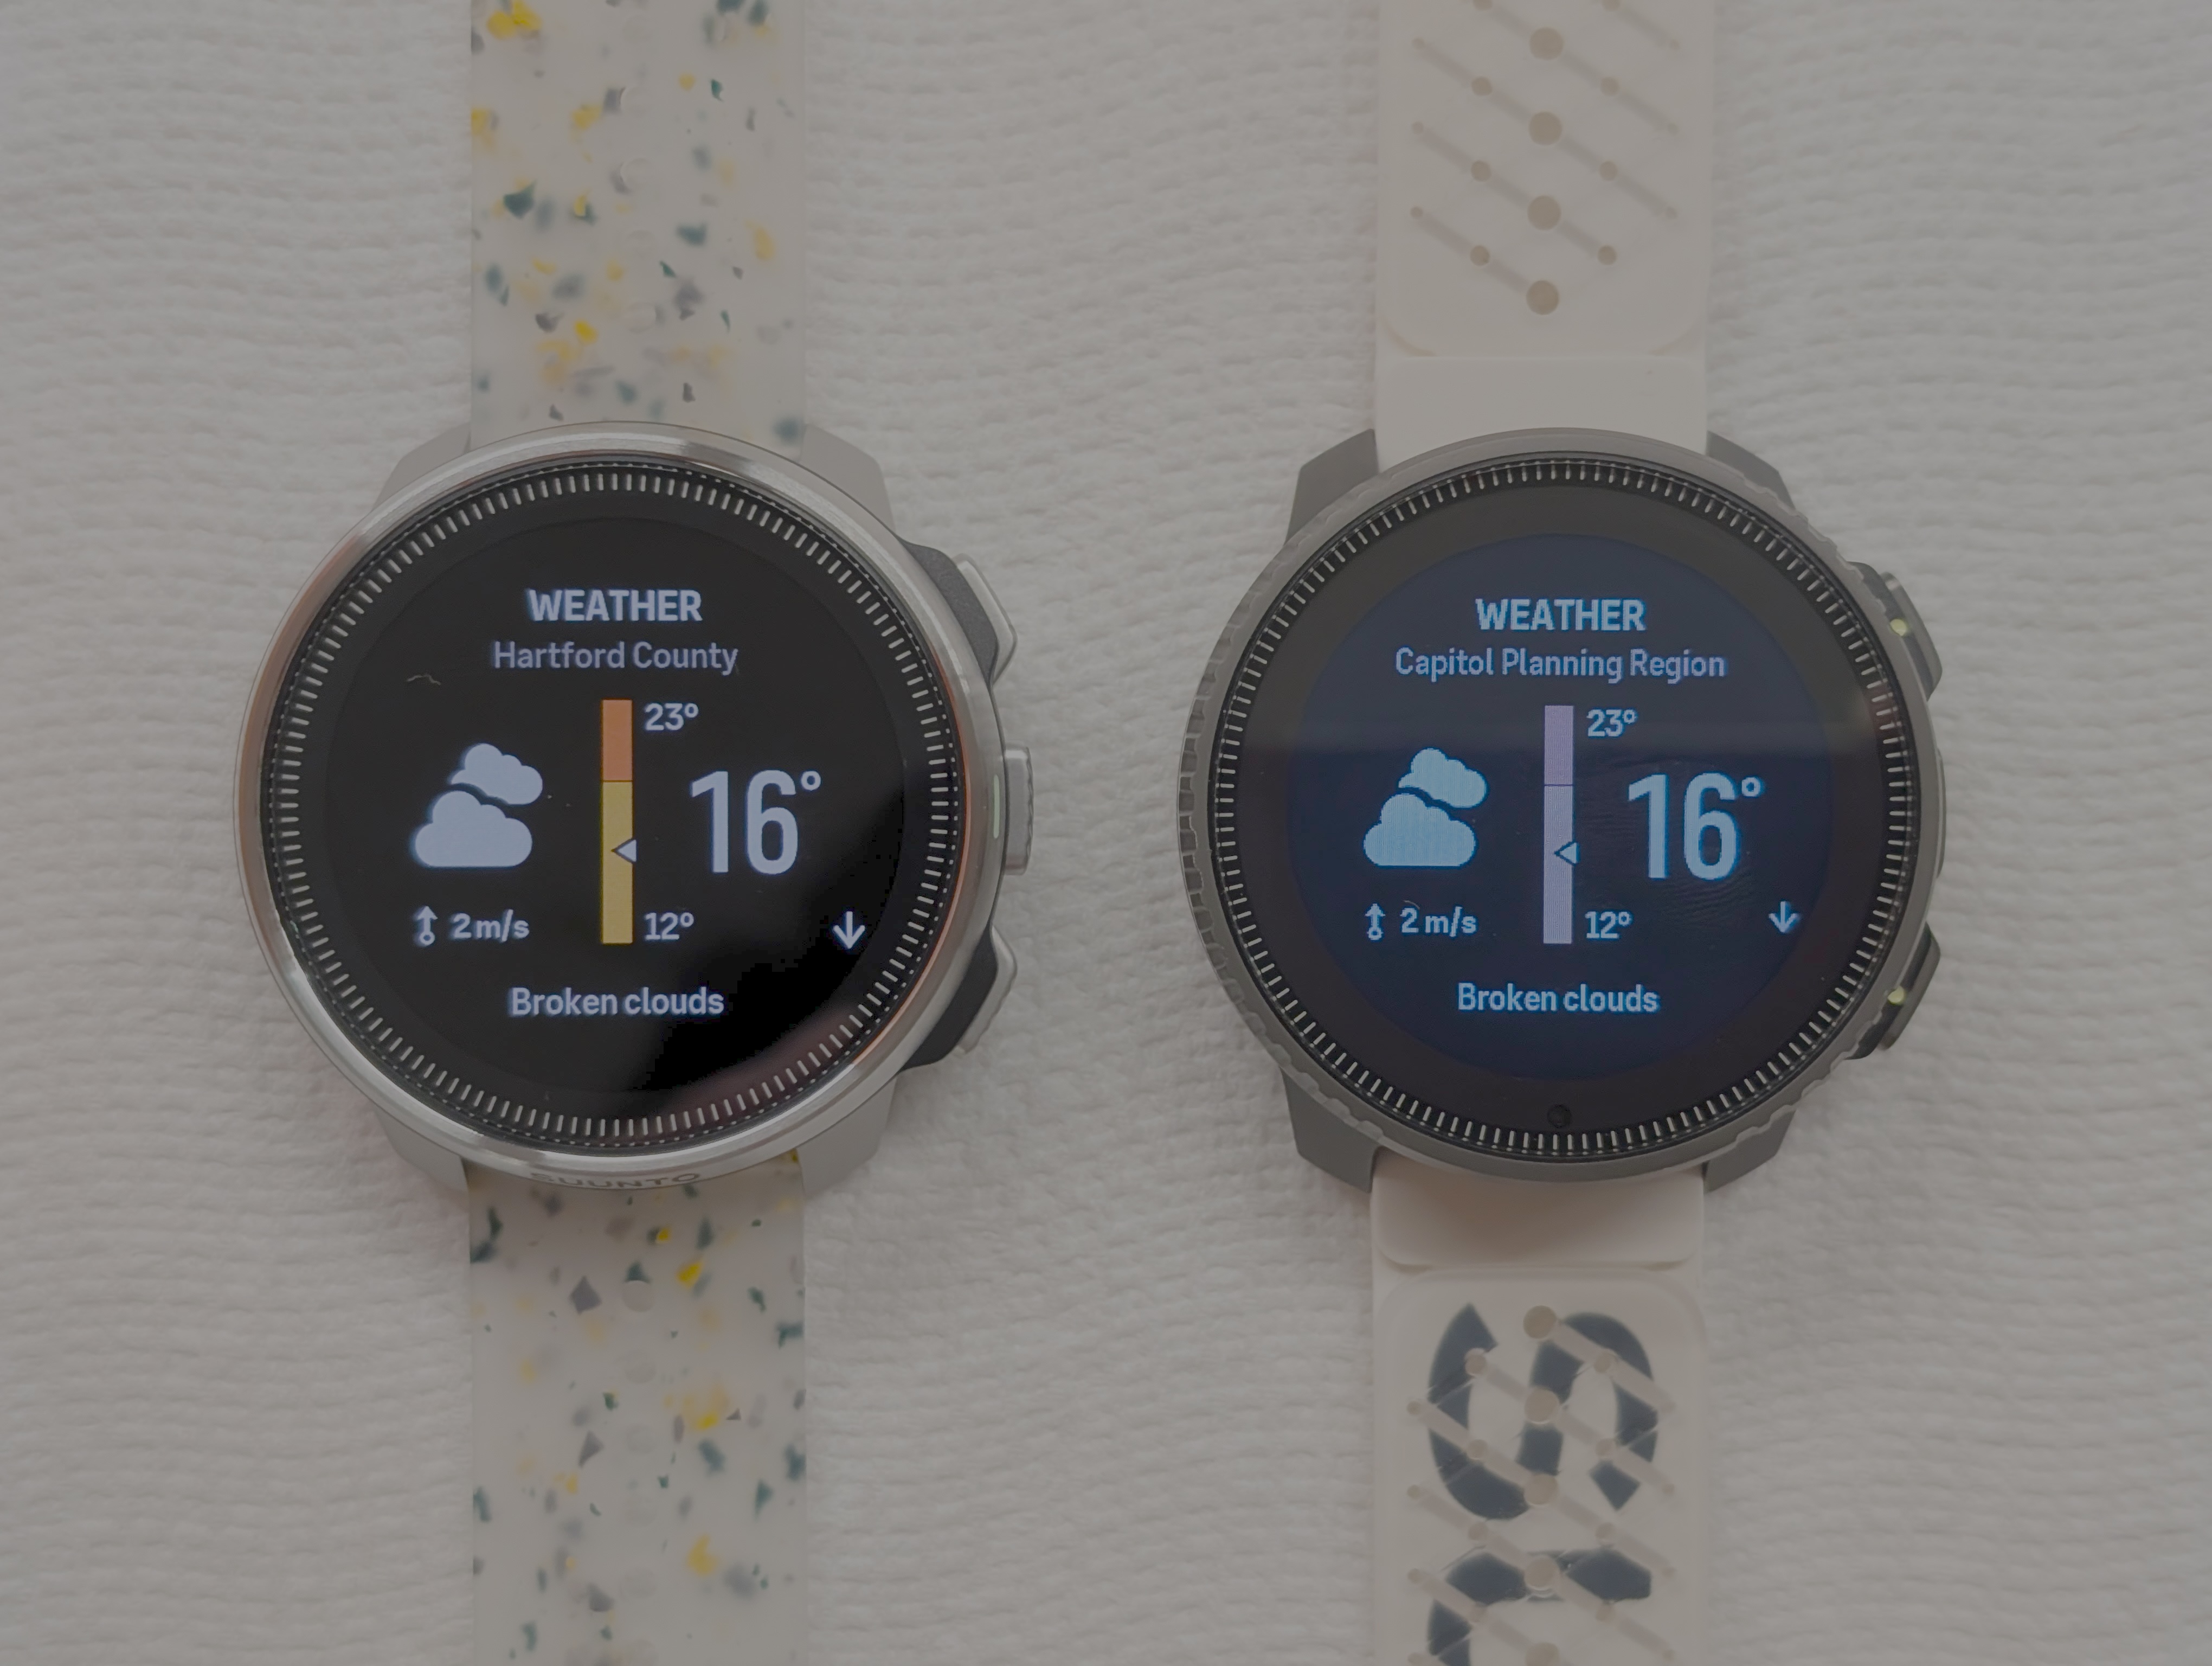
A quirk I have discovered is how the data from Android is presented as “Hartford County” (Ocean) while from iOS “Capitol Planning Region” (Vertical). The latter is technically correct as Planning Regions have now superseded the legacy Counties as CT’s County Equivalents by the Census Bureau.
So the iOS dataset is somehow more up to date, but I doubt there’s any difference between the two. I have yet to verify if it corresponds to updated definitions (add/drop of towns) in real life.
I can’t imagine what happens at San Bernardino County, larger than a whopping 9 states at over 50,000 km², especially in times of heat waves and drastic temperature differences as illustrated on your map.
-
@Jonathan-C said in No more weather in my location (City) it shows district now.:
@Ze-Stuart thanks for the excellent write up!
You’re welcome! Nothing like nerding out on something.
I can’t imagine what happens at San Bernardino County, larger than a whopping 9 states at over 50,000 km², especially in times of heat waves and drastic temperature differences as illustrated on your map.
Bad data for bad decisions and grumpiness when plans have to be revised. Good example though: that covers the terrain from Las Vegas to Los Angeles, ranging in altitude from something like 1400m down to 0m. Last time I was there was that year of unusual weather where the snow settled on the strip: our flights were cancelled due to lack of de-icing equipment so we drove. Beautiful, but.
-
I’ve logged this with Suunto as ticket 7480235, @Jonathan-C I linked to your recent post as well as mine with the temperature breakdown.
If anyone else wants to log a ticket with support, link to this thread and mention my ticket number, citing the geo that you’re in.
@Dimitrios-Kanellopoulos @isazi @Brad_Olwin if appropriate any internal mention of this would be greatly appreciated.
-
Gosh support has become a challenge: in 7 days, I’ve been asked to ‘reset the weather settings’. This includes making sure the app has permission for location access, and then disabling the weather widget, restarting, and then enabling it again, but to get to that point took 3 emails.
Sigh, just venting about the frustrations of support: it’s a shame they seem so terribly under-resourced: not enough people, not enough training (any training?) on the app or the watches.
-
Update from support:
I got an update from the upper team and they told me this “the difference in location display is due to the different APIs for obtaining weather locations on Android and iOS. I can tell you that our development team is constantly optimizing the weather service function. There will be a more reliable display of weather place names in the future.”
-
@Ze-Stuart I have just read your Waverly and Alameda County post with temp difference 31° to 39°.
One question: do the watches acutall report different temperatures or is just the caption different?
From your pictures the temperatures are exactly the same… -
@Ze-Stuart said in No more weather in my location (City) it shows district now.:
Update from support:
I got an update from the upper team and they told me this “the difference in location display is due to the different APIs for obtaining weather locations on Android and iOS. I can tell you that our development team is constantly optimizing the weather service function. There will be a more reliable display of weather place names in the future.”
Thank You for sharing this!
-
@Egika said in No more weather in my location (City) it shows district now.:
@Ze-Stuart I have just read your Waverly and Alameda County post with temp difference 31° to 39°.
One question: do the watches acutall report different temperatures or is just the caption different?
From your pictures the temperatures are exactly the same…It wasn’t a good example, but they had been showing different temperatures and forecasts. That’s why I added the map with the OpenWeather forecasts, to illustrate the range.
-
It’s still the same for me, any news ?
-
@Kramble no, I haven’t heard anything, so I assume they’re still constantly optimising the weather service function.
-
Still no news for this location issue on the weather widget on Android ?
It’s quite a long wait now …
-
Today , the issue seemed fixed for me with the app V6.4.6.
Is it the same for you ? -
@Kramble mine just says England


 Gone from local, to county to country!
 -
@Kramble said in No more weather in my location (City) it shows district now.:
Today , the issue seemed fixed for me with the app V6.4.6.
Is it the same for you ?I almost forgot about my thread :D. Yeah just noticed on my Race 2 it says city again now! We’ll see if it will lasts.
-
@Tami999
Same here. I got my city’s weather back with version 6.4.x
Finally
-
Great news ! Thanks Suunto dev team !
-
@Audaxjoe Similarly, in the Czech Republic it now went from district to region (which contains like 5 districts statistically)…


-
@inkognito mine went to city and has now gone back to “England”
All rather vague, England is a pretty big place


 ️
️I guess it will go back to town at some point.