Suunto ZoneSense
-
@tschogo said in Suunto ZoneSense:
Very interesting to read. I think Suunto needs to address this more clearly in their ad/description for ZoneSense. With this I mean how crazy widespread ones AT can be on a daily basis (on a HR scale). To me, not being any sport scientist at all, it still feels crazy, that on one day AT can be at 140, the next at 160. But I‘m very curious to see where this journey goes and will use ZS on all my upcoming trainings.
Mine vary as much or more than yours! I believe this is the power of ZS! I train primarily by RPE and ZS is scary good at matching my RPE. On days I feel even a little tired my AT has tanked according to ZS. I am primarily using ZS to keep my Endurance and Recovery runs easy enough.
-
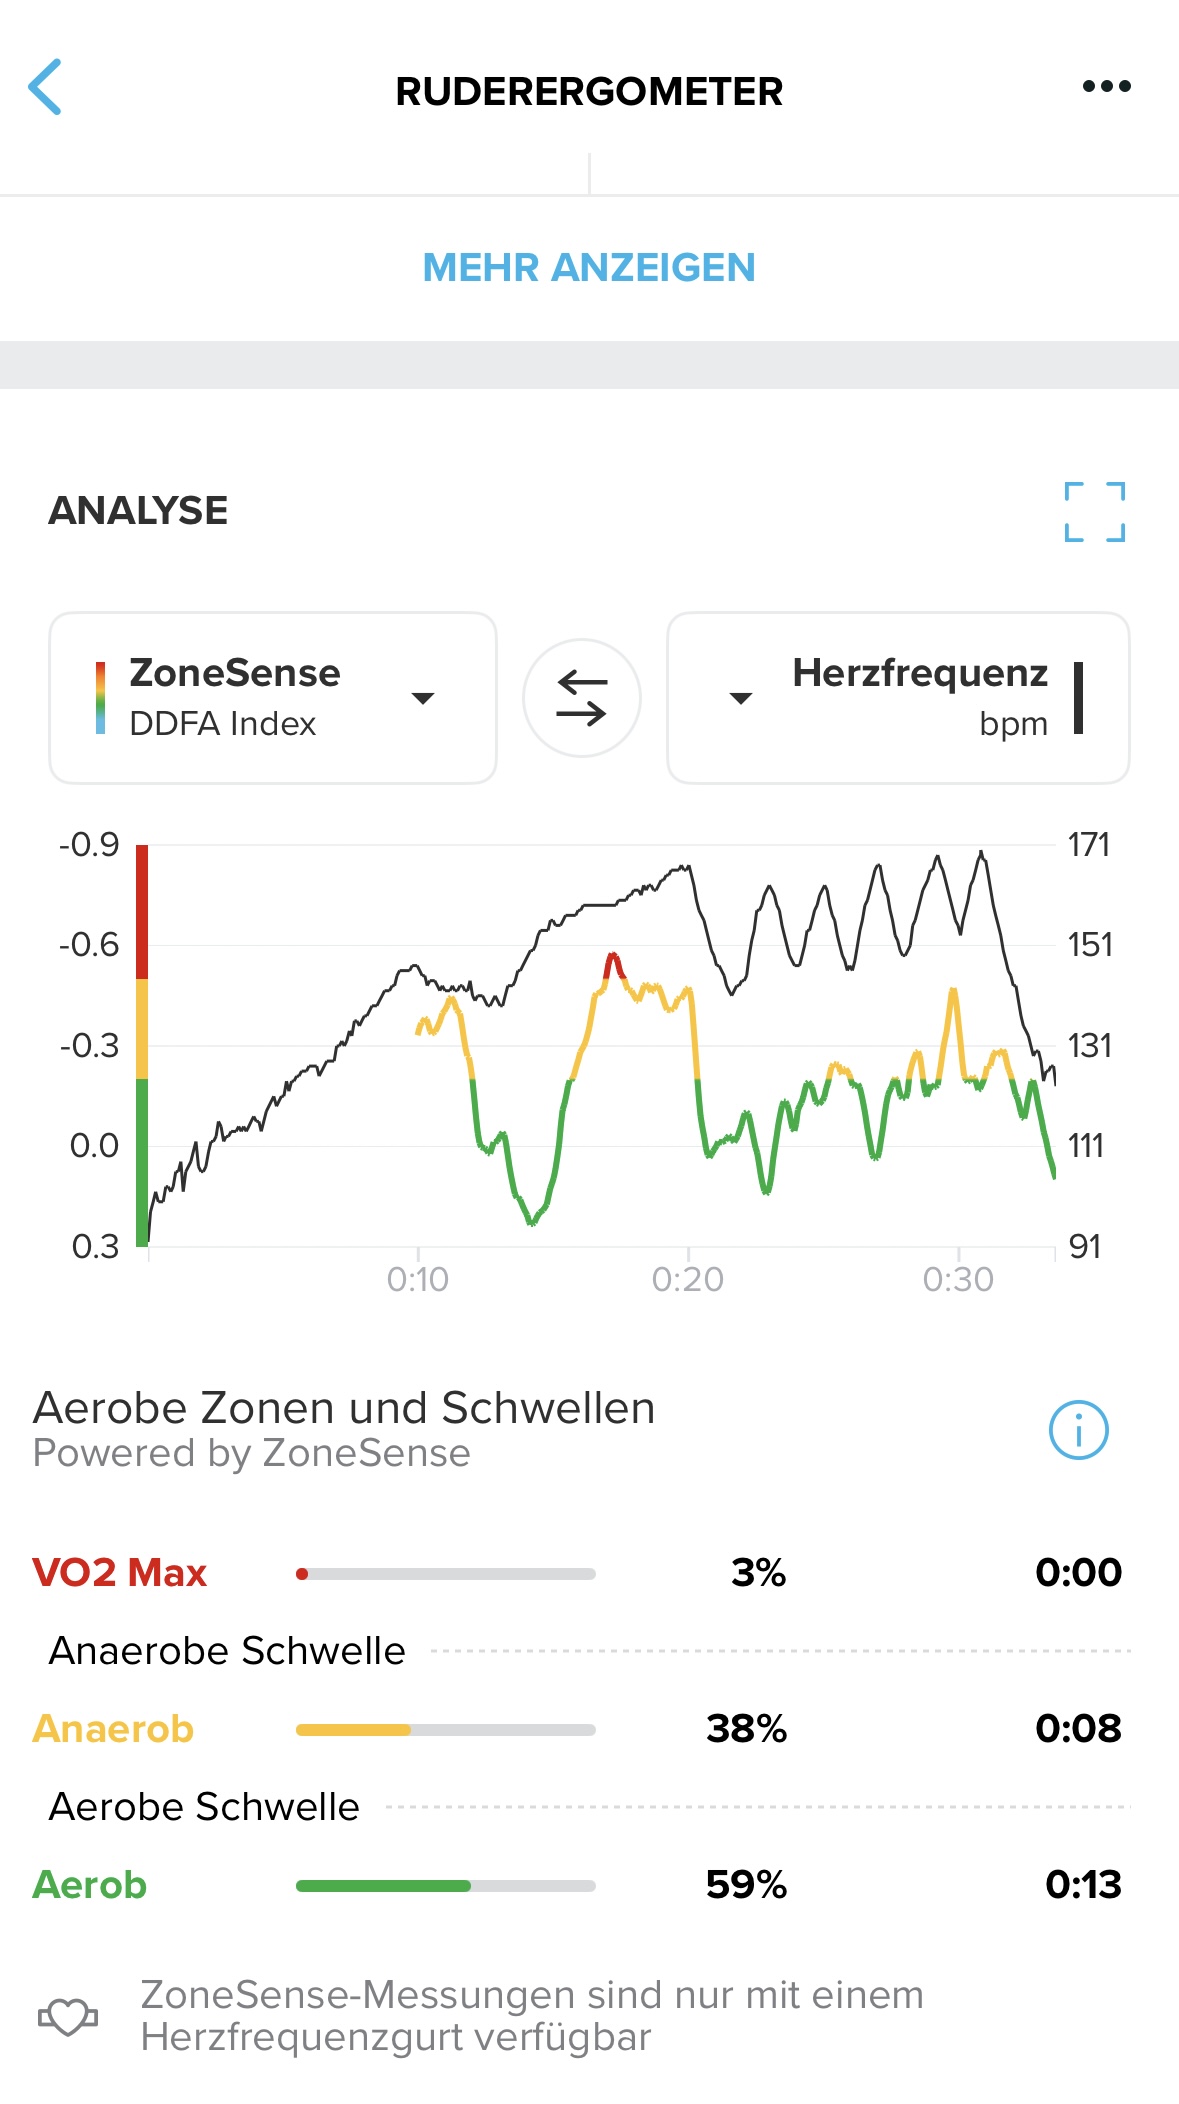
@borgelkranz this is one of my last rows on concept2. This is the graph from the app. On the watch it was shown always green. It does not work on the watch, only the result in the app is clear.
-
@Sportsfreund and I can’t imagine the waves while the heartrate is constantly rising.
-
@Sportsfreund thx for sharing.
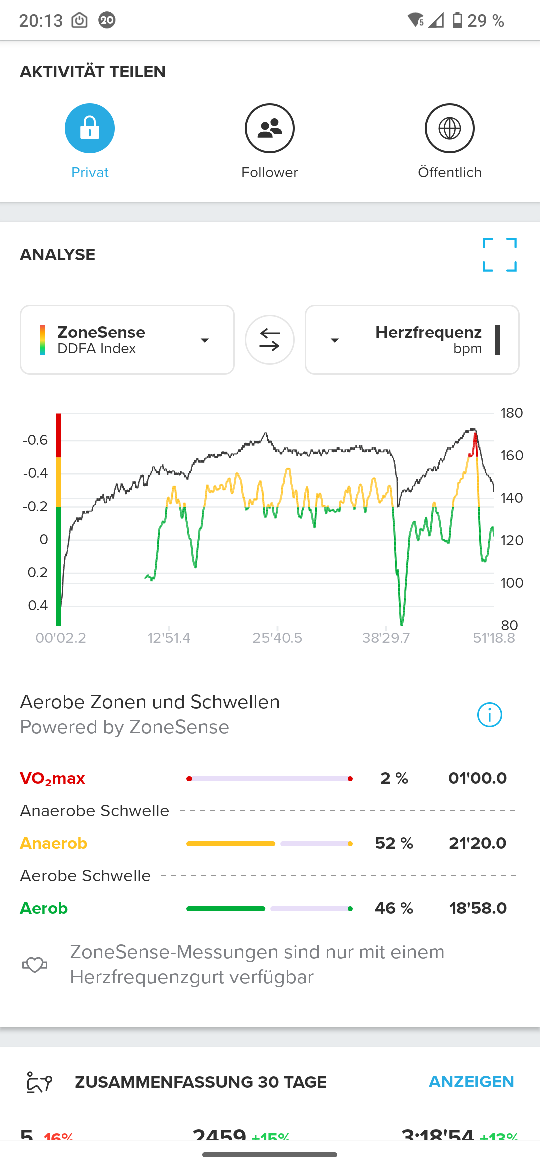
I am too stupid to upload pictures, it appears. If you can give me a hand I will post some.Finally I found the upload button.This one is from a an 8k cadence drill. 24 spm sandwiched in 22 spm blocks (both with the same intensity) followed by a ramp test to push me to the limit. Bad idea, I know. But wanted to test whether ZoneSense detects my anaerobic threshold, which it did.
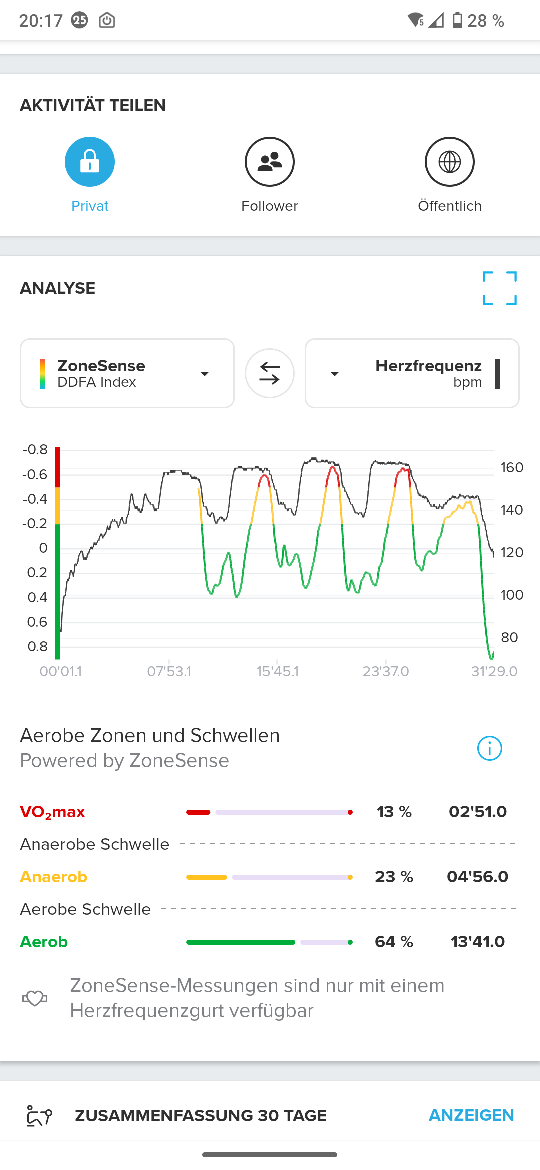
This one is from long intervals that start with 30s of VO2max intensity,directly followed by a longer perior of at around FTP:
-
@borgelkranz Go to your pictures. Copy it and paste it here.
Yea this forum with its „ insert attachment“ does not work.
It only made for older user which still use a PC.
-
@borgelkranz does your watch show the zone sense graph in realtime? Or also delayed or after end activity in the app?
-
@Sportsfreund sorry I don’t get it even though I am one of the old people…
-
@Sportsfreund I do not see a graph on the watch but a bar that is color coded. Data is displayed after 10 minutes of warmup as explained in the description of the Zonesense app.
-
@borgelkranz yes. This is what I mean. I bar. A graph. A colored line. So what.
-
Regarding the delay on ZS reacting, I’ve been testing out on threshold intervals and, although this is likely quite personal, for me it is about 10s behind the related change in HR. Of course there’s often a 10s to 20s delay in my HR reacting to a sudden increase or decrease in pace so overall ZS has a total lag for me of around 30s. Personally I think that’s pretty decent given I’m used to the 20s or so lag on my HR
")
-
One observation I’ve seen is, if we warm-up way slower than what a regular warm-up pace is for us, this will make ZS have a lower baseline and hence thresholds (if measured) will be lower as well.
Advise is, do aerobic warm-ups but do not do them at a slower pace than your regular warm-up.
-
@Sportsfreund I actively monitored that only during a hike and during one of my bike commutes to work. I shot a foto of the watch after the hike:
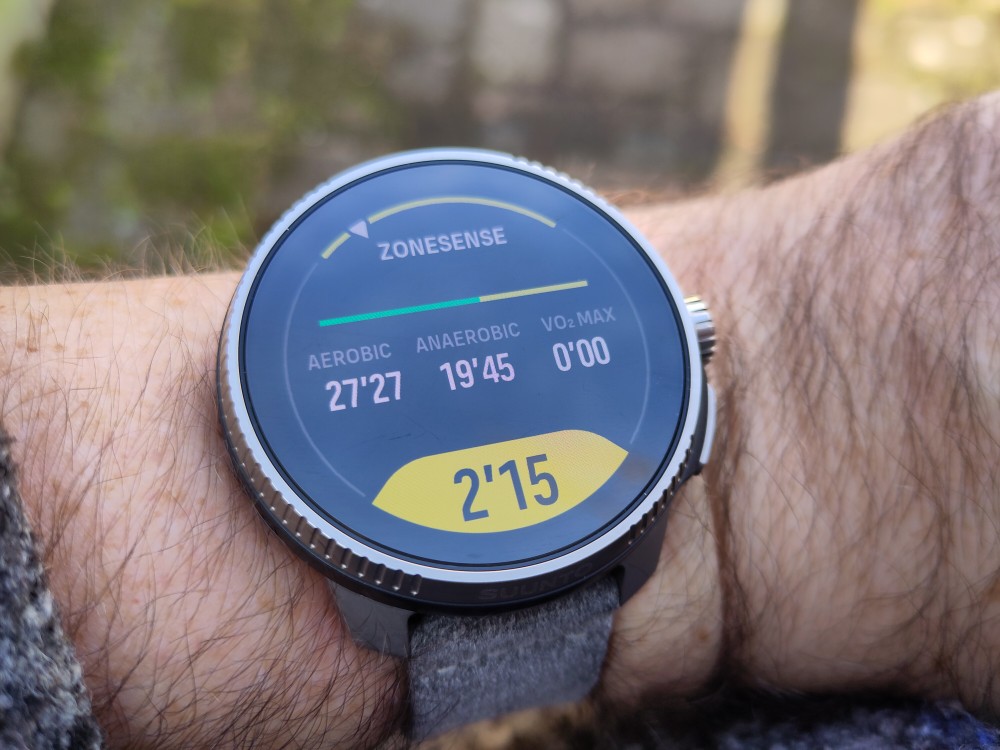
In SuuntoApp this looked like this:
Not a perfect match I’d say…
Caveat: this was the first hike I did using a HF belt and ZoneSones. So perhaps this is not yet calibrated?
-
@borgelkranz As I said before and info extracted from the Spanish Forum, the inconsistency between watch and app should be solved with next android app version, is seems that it is already fixed in iOS.
-
@cosme-costa I can confirm being on iOS and not having the issue.
-
@Mountain i also dont have problems with iOS app. Only the delay in the watch.
-
@Mountain i definitnely have discrepancies between the app and the watch. strong ones i would say. my last run shows in the app like 40% in Red while the watch showed like 1-2% (in iOS)
-
@Mountain
Does it make sense to set these measured values in my 5 zone model in the watch?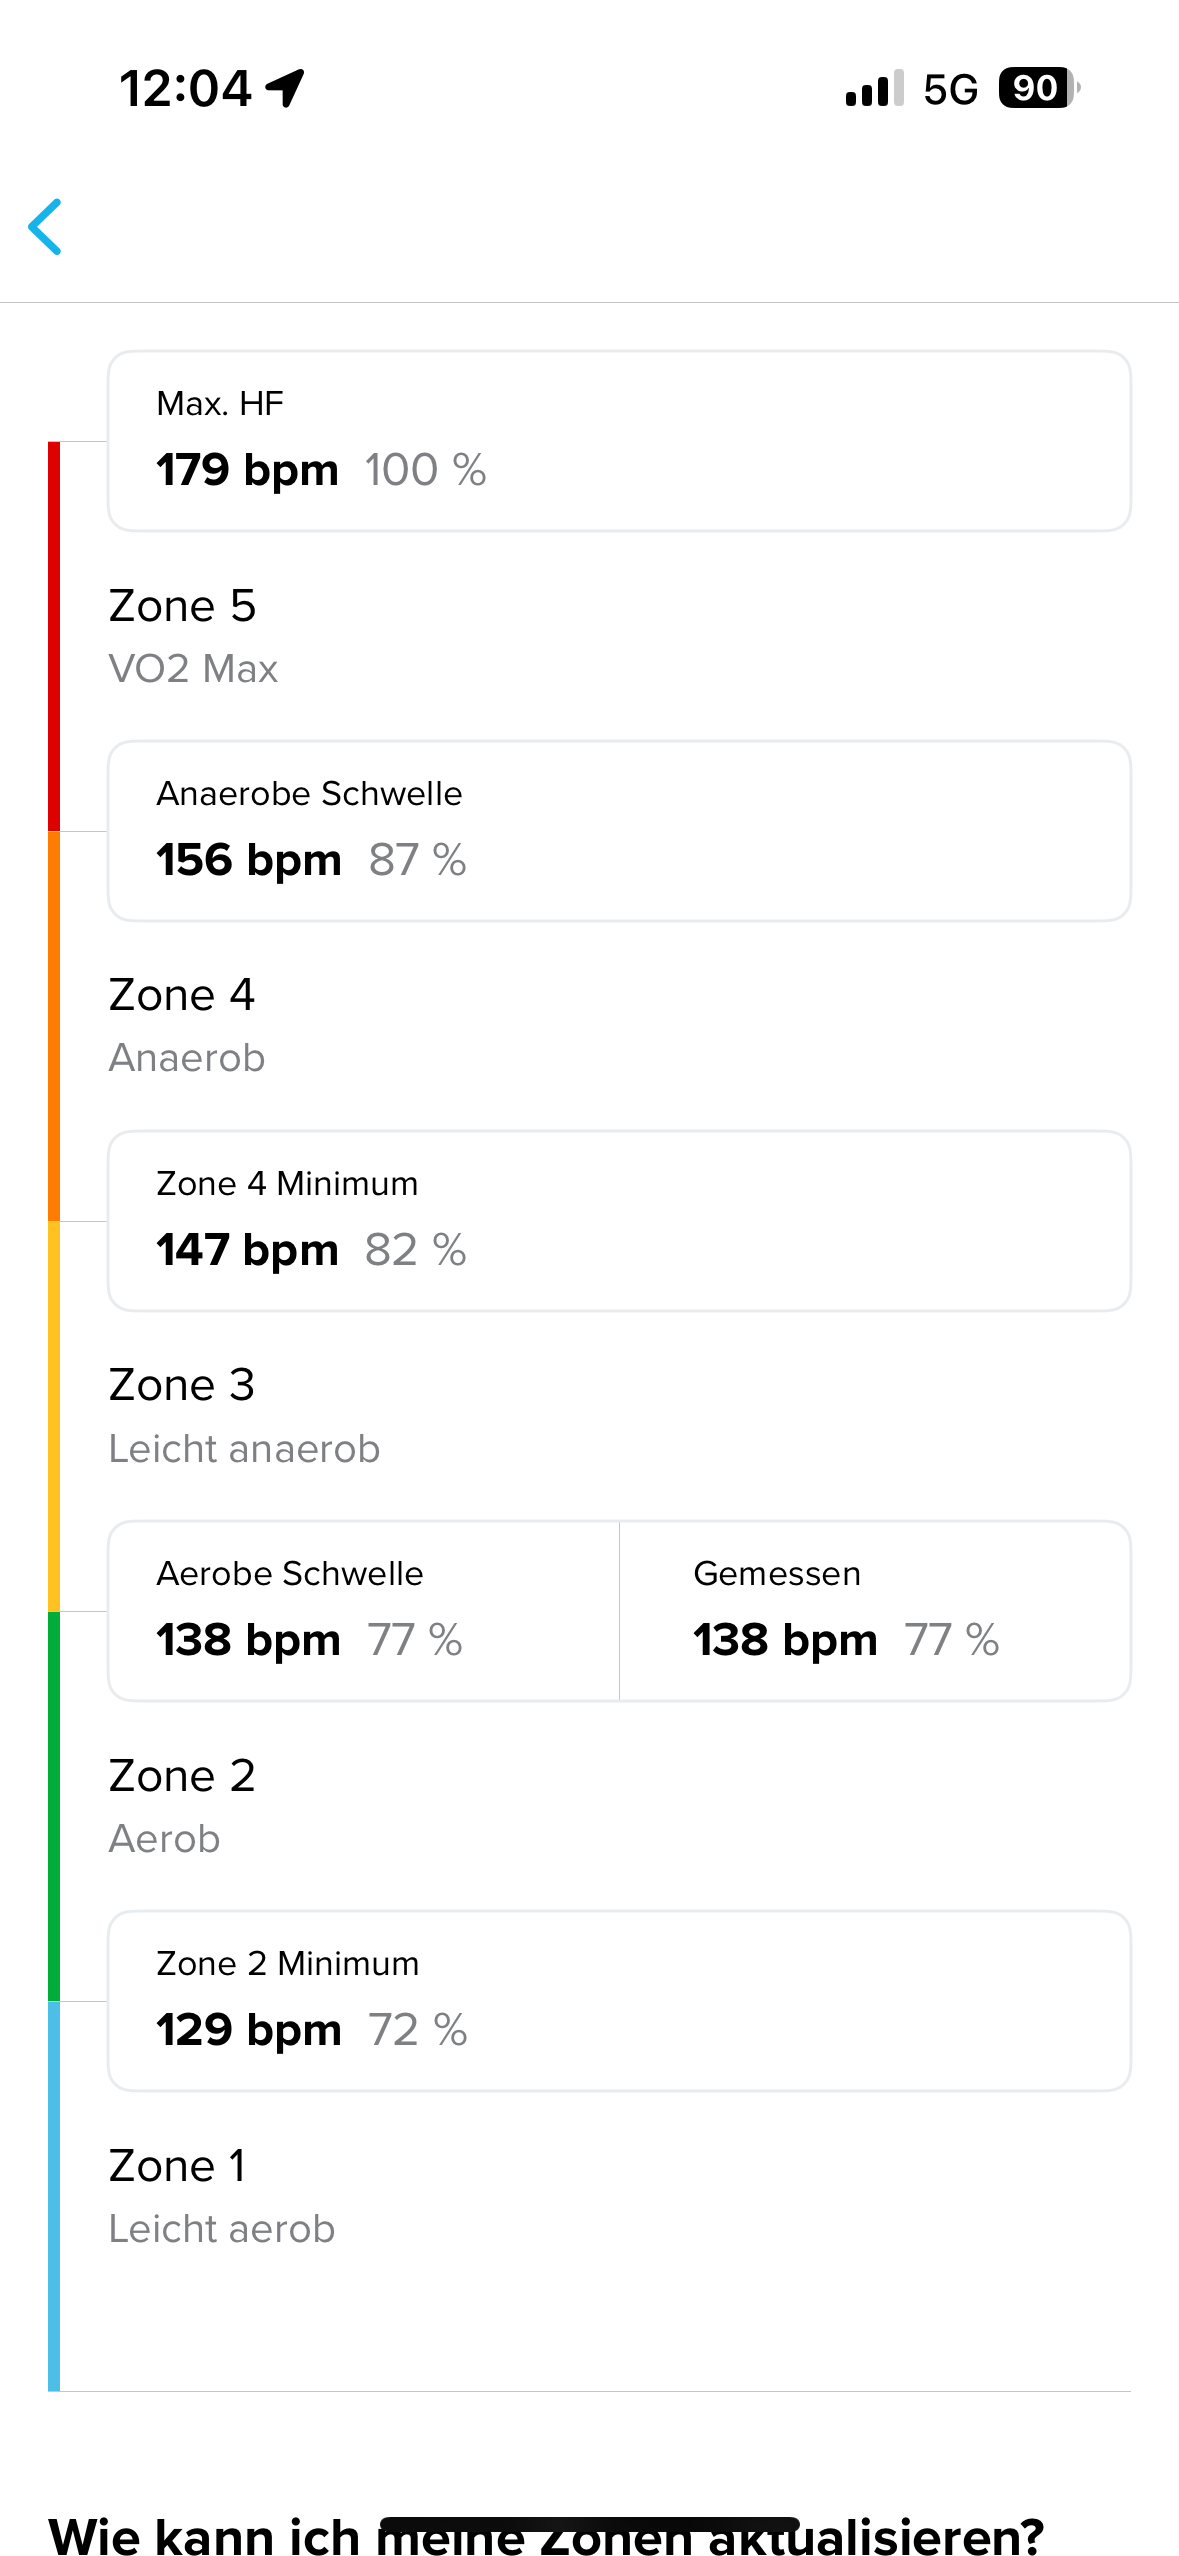
-
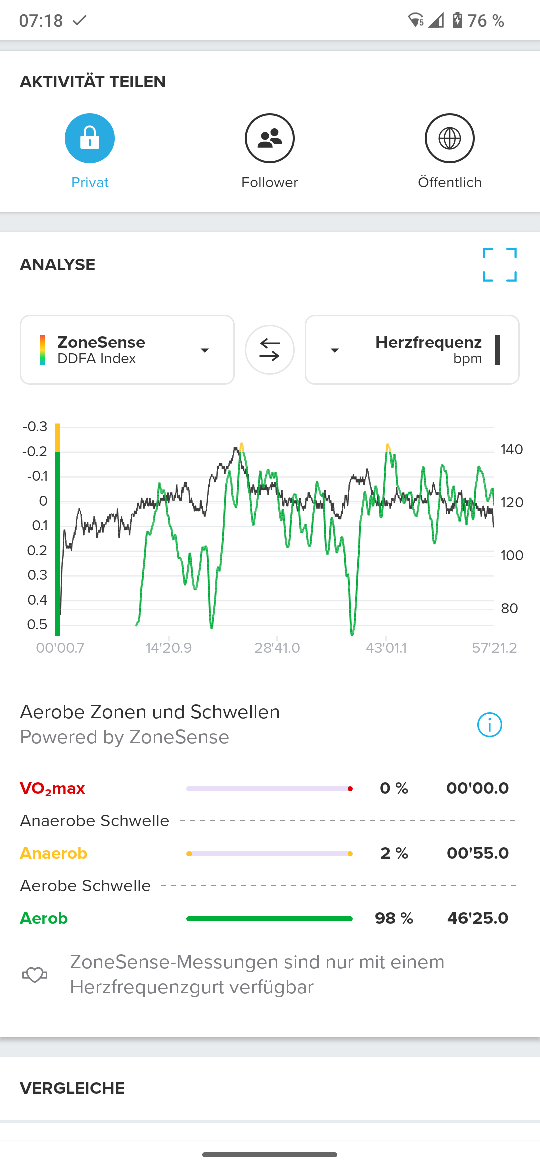
@Sportsfreund It’s a measurement from the last workout this morning. A 10km run in my slow feel good zone. (Green zone from SUUNTO Zone Sense)
-
@Sportsfreund Next inconsistency I found is, when I ran in ZoneSense Green Zone, which means AEROBIC, the Suunto App classifies the activitie as an AEROBIC/ANAEROBIC activity, because the Heartrate often was in Heartratezone 3.
This is not the trueness when I run while using ZoneSense instead of the HR Modus. -
@Sportsfreund This is true, automatic tagging is based in HR and not in ZS. I think and hope, that eventually, they will let you chose between which base you want to use, HR or ZS.