Suunto ZoneSense
-
@pilleus you might be falling in the case of overanalyzing the graphs
 .
.In my case I keep it simple, even Suunto says it in one of the videos, don’t really pay attention to patterns within the same color, green is green, yellow… Etc.
There are was a great comment shared by @Brad_Olwin I think, where he said something along the lines of, 30 or 60 mins of HRV data contain more data points than whole # of sand grains in the Sahara, so short version is, hrv is complex.
-
@herlas said in Suunto ZoneSense:
@pilleus you might be falling in the case of overanalyzing the graphs
.No, I don’t think so. I am just interested in the way the algorithm is working.
Sometimes I get clear numbers of aerobic and anaerobic thresholds, after the same training a few days later with an identical graph in ZS I do not get it.
And the fact that the watch is showing two or three times within an activity of 2,5 hours a constant up to the red zone followed by a rapid down to the lowest green zone. Not visible in the app afterwards.
That’s what I try to understand.
-
@pilleus There may be some app vs. watch discontinuity. I am using this enough I will ask Suunto about this, it would not be surprising.
-
I’ve noticed I don’t always see the ZS interpreted LT1 and LT2 HR values in the zones diagram and I assume that means it agrees with what I already have set for my HR zones.
I also note in the FAQ Suunto do say that every activity with an HR belt contributes to a personalised baseline tuning and I think it fair to suggest this analysis is done on Suunto servers, not on the watch. So the watch is effectively always going to be one activity behind the app in terms of calculated baseline and the resulting ZS graph data.
Chances are, the suuntoplus app is going to be using a simplified approximation algorithm based on tuning values sync’d from the analysis of previous runs to show you “live” data. I honestly don’t see the watch app crunching all the data for 50 or more time period buckets of vector transformations as needed for the full DDFA.
-
@far-blue said in Suunto ZoneSense:
I also note in the FAQ Suunto do say that every activity with an HR belt contributes to a personalised baseline tuning and I think it fair to suggest this analysis is done on Suunto servers, not on the watch. So the watch is effectively always going to be one activity behind the app in terms of calculated baseline and the resulting ZS graph data.
If this is the case and the baseline recalculated after the activity on Suunto servers is not synchronized into the watch, then the live display on the watch would be pointless for me …

https://www.instagram.com/moves.are.life/
Suunto Vertical Black Lime
Suunto 9 Peak Pro Black
Suunto Spartan Ultra Stealth Titanium -
@pilleus I don’t expect the difference will be massive as this would only be fine tuning. But if you are ill or fatigued or some other short-term / acute variation in your physical state then maybe the live data will be a little out. There could also be artefacts caused by the approximations in the maths I suggested (without any evidence, just me opinion) in the live data you can learn to ignore.
-
Today, both on the vertical and afterwards in the Suunto app, ZS was identical to my feeling and effort on the uphills on the bike. It doesn’t have to be any better …

As with the heart rate, the delay cannot be compensated for, as the data analysis and display take time. It’s okay for me and I can see it on the hand of the outer ring on the watch when the effort increases during uphills.
-
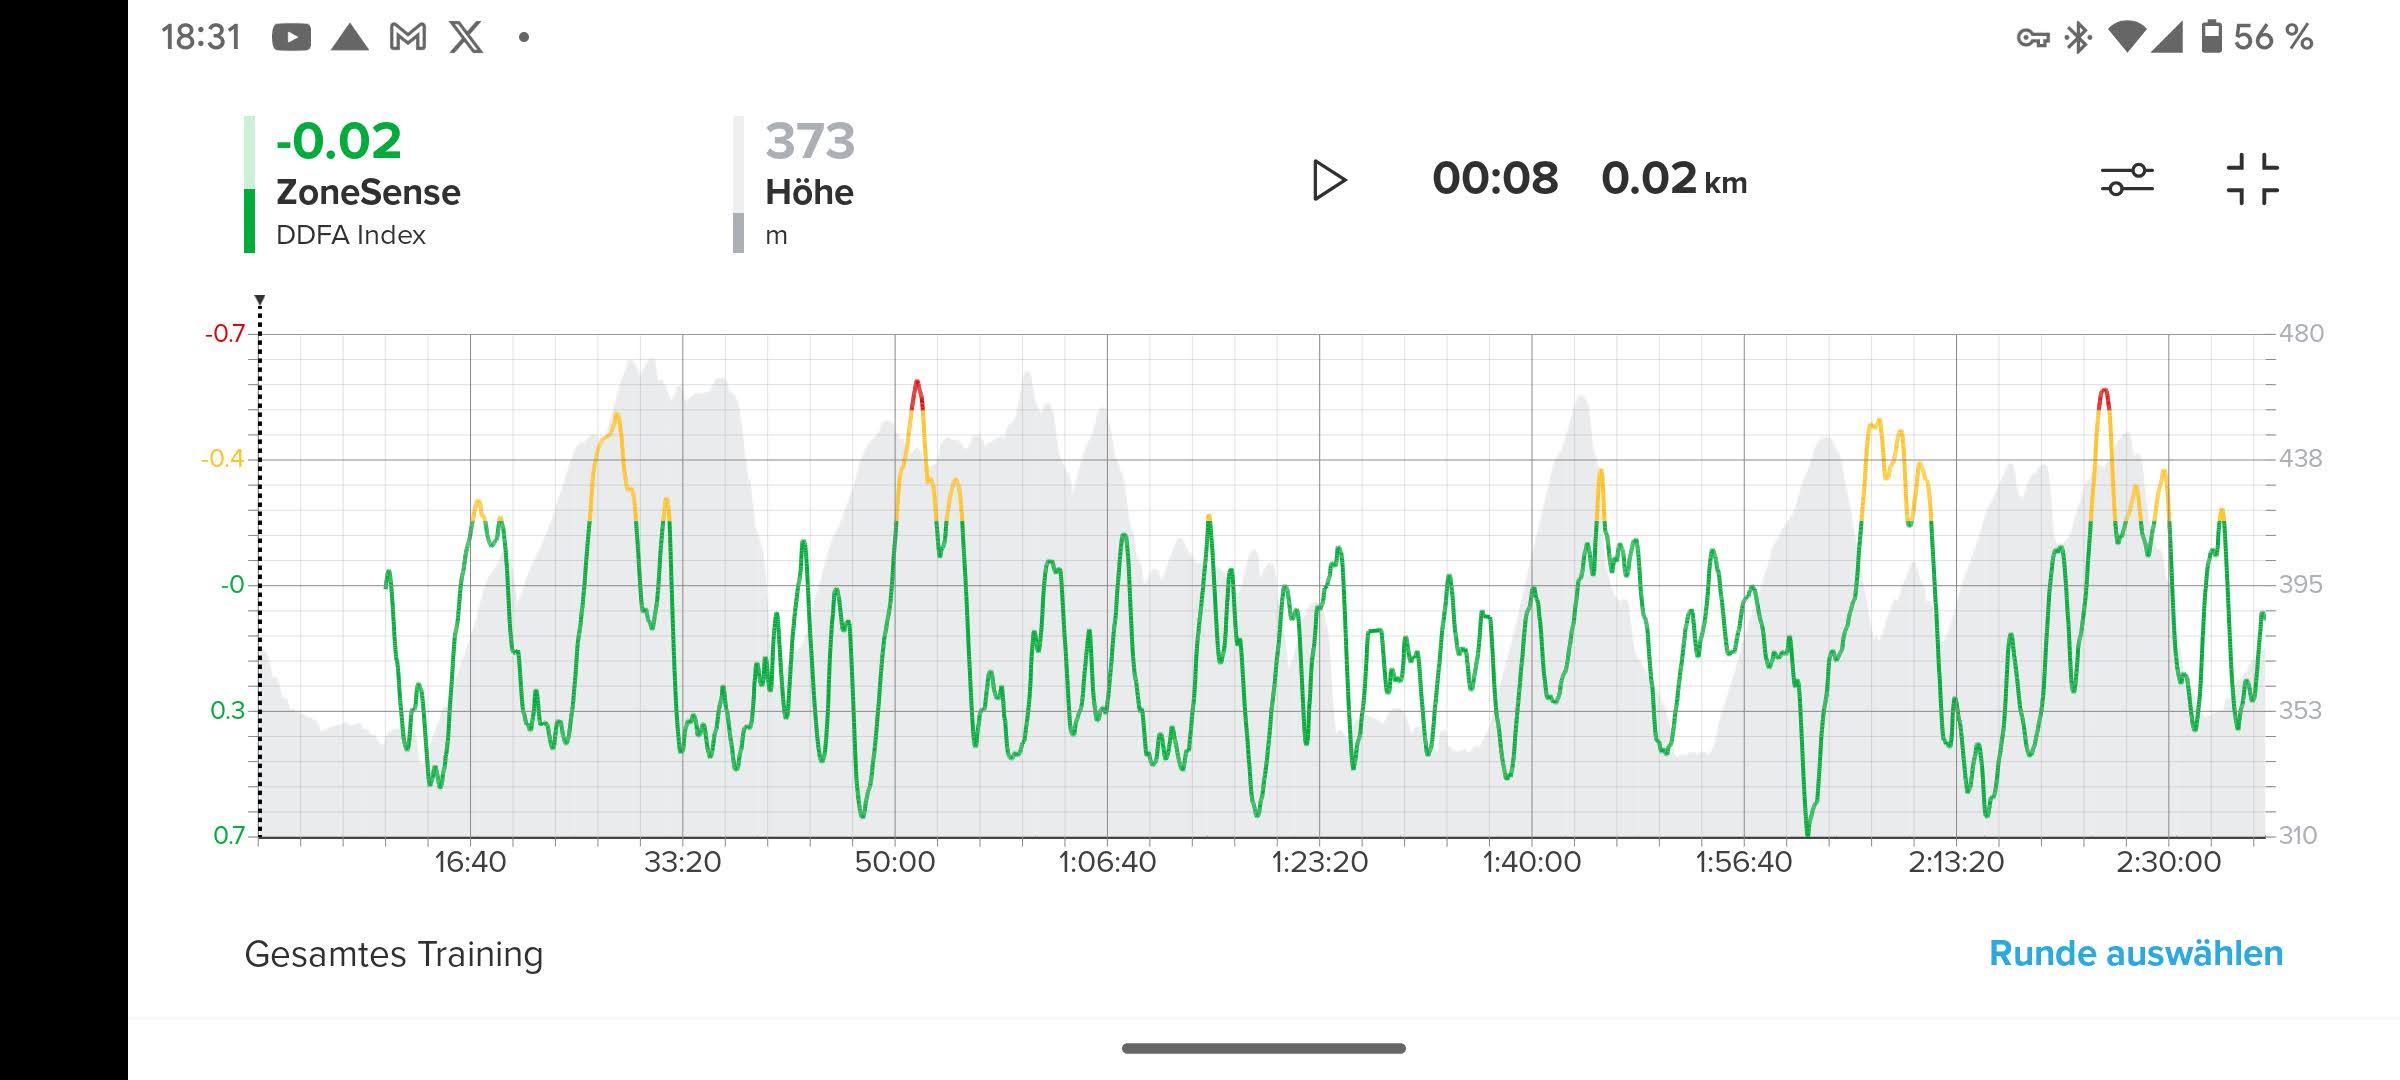
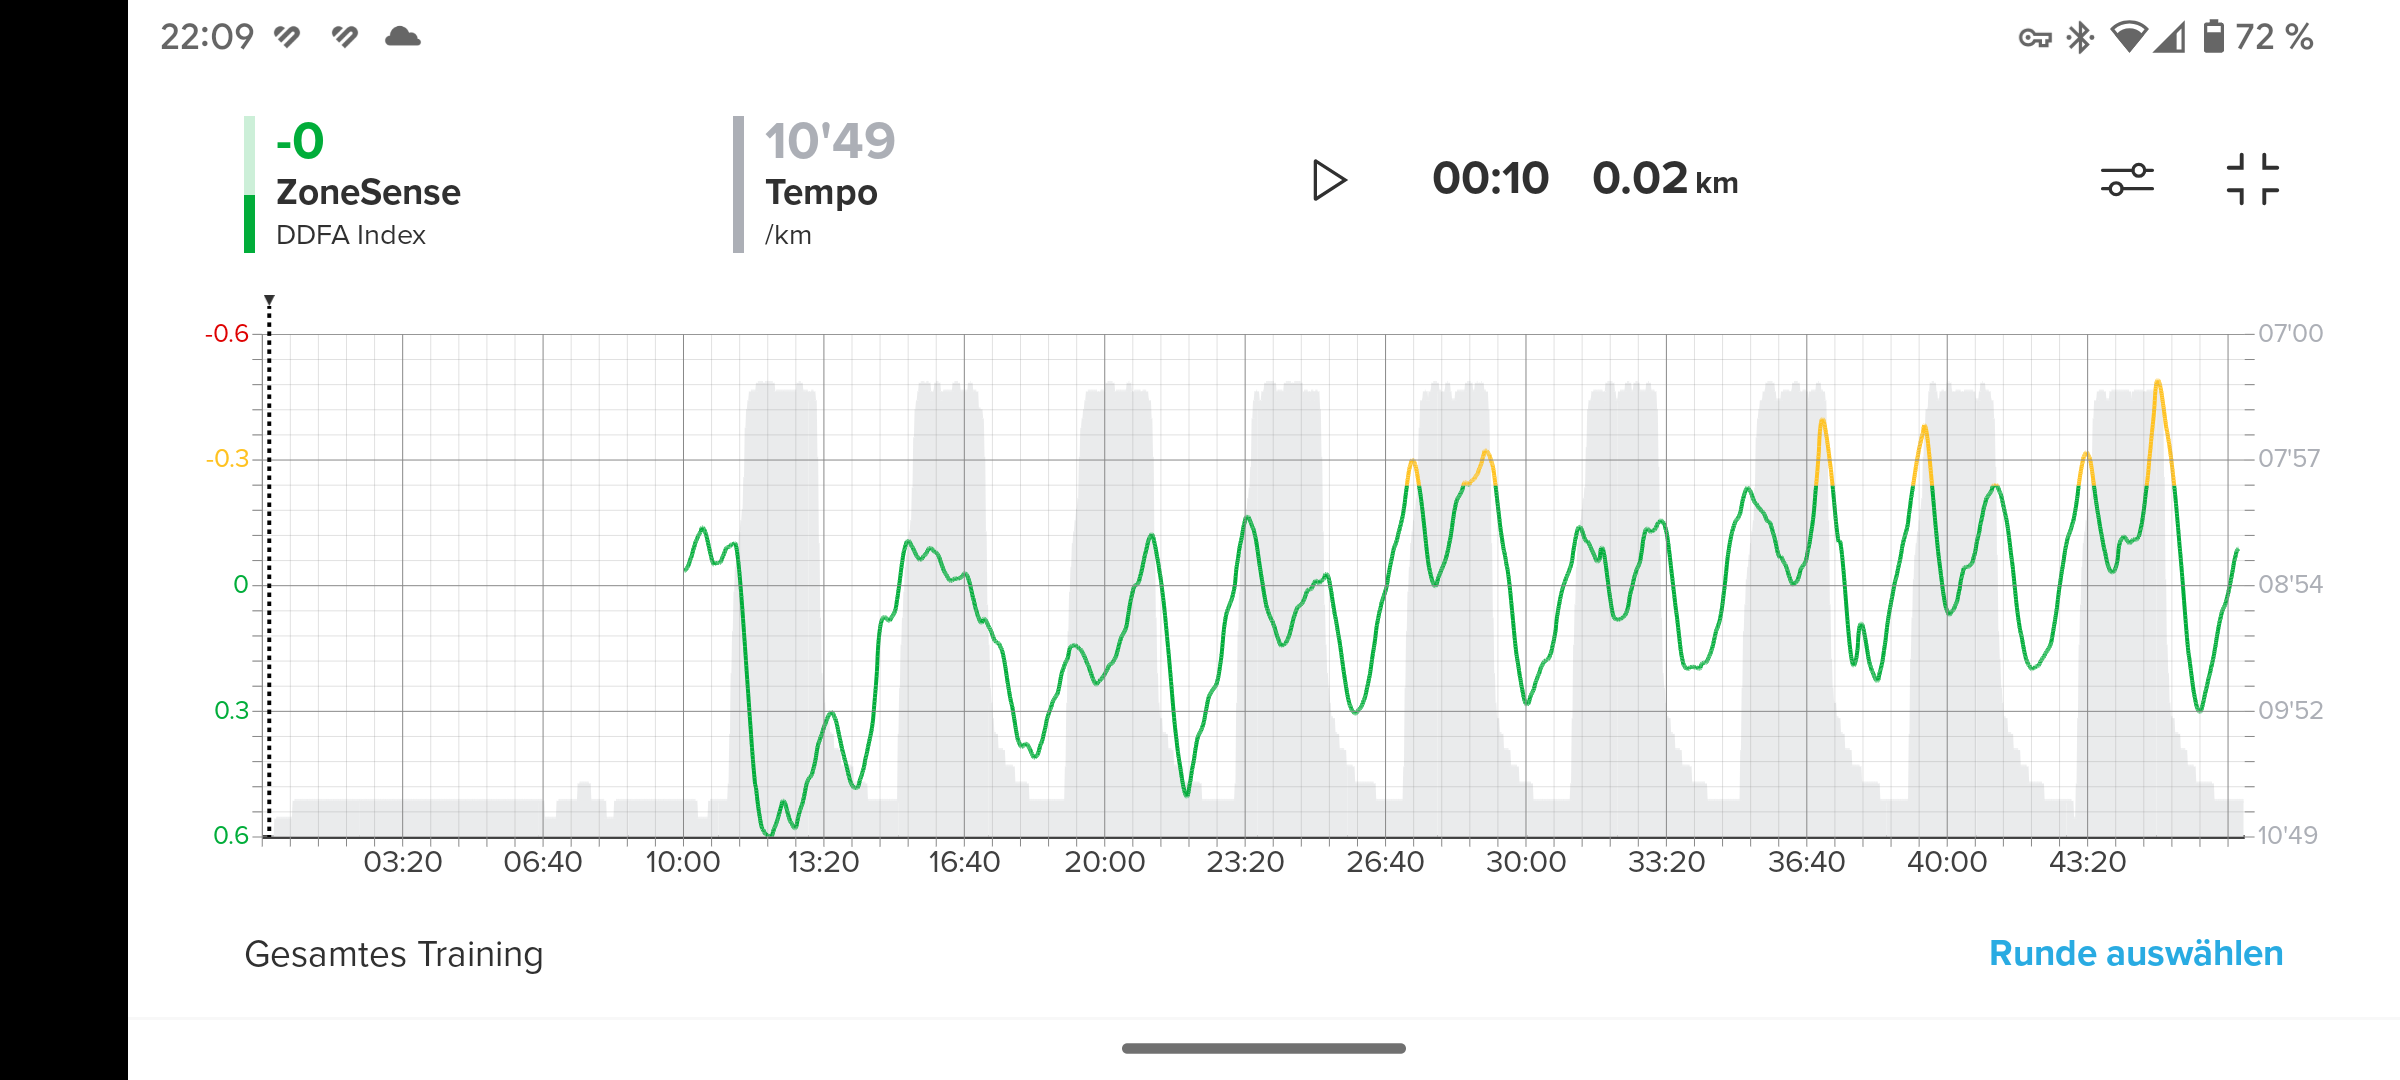
I am still having trouble interpreting my zone sense results. Especially with long intervals, the DDFA index is the opposite to what I would expect and the thought of guiding my effort in real time using ZS is unreasonable. Today’s effort is typical of what I am seeing. Does this imply some non-standard physiology, a potential underlying pathology, or am I simply misunderstanding the results?
Suunto M5, Quest, Trackpod, A2S, SSU, S9B, S9P, Race
Garmin 305, 60, 405, Fenix 2, 945, 955
Polar M430, Vantage V -
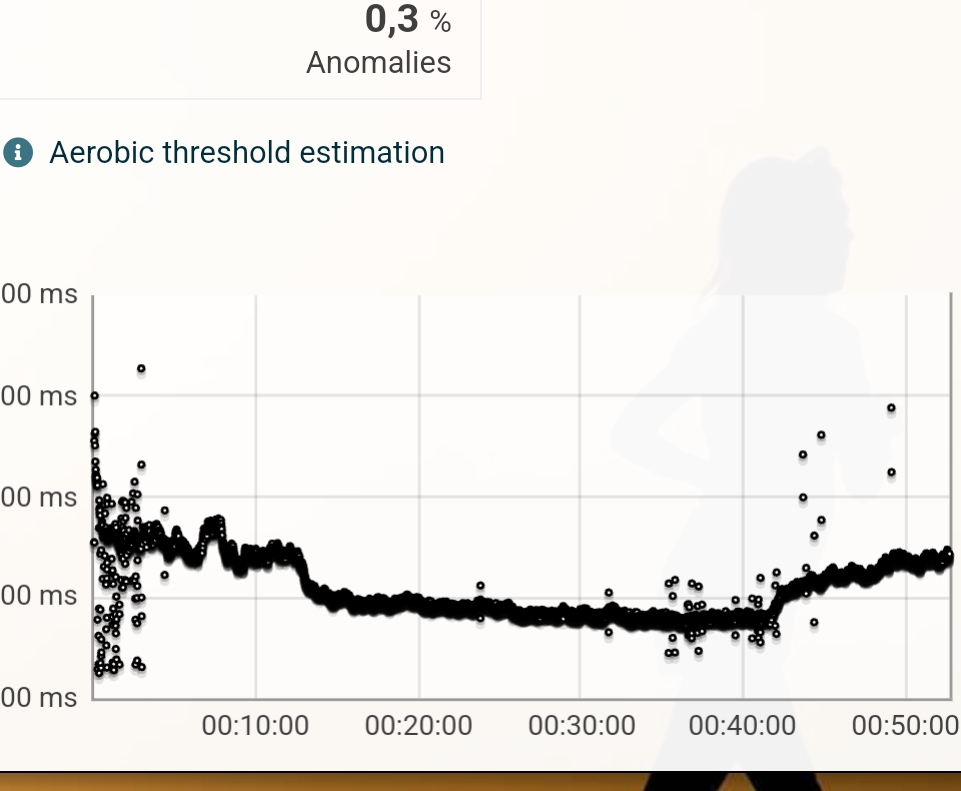
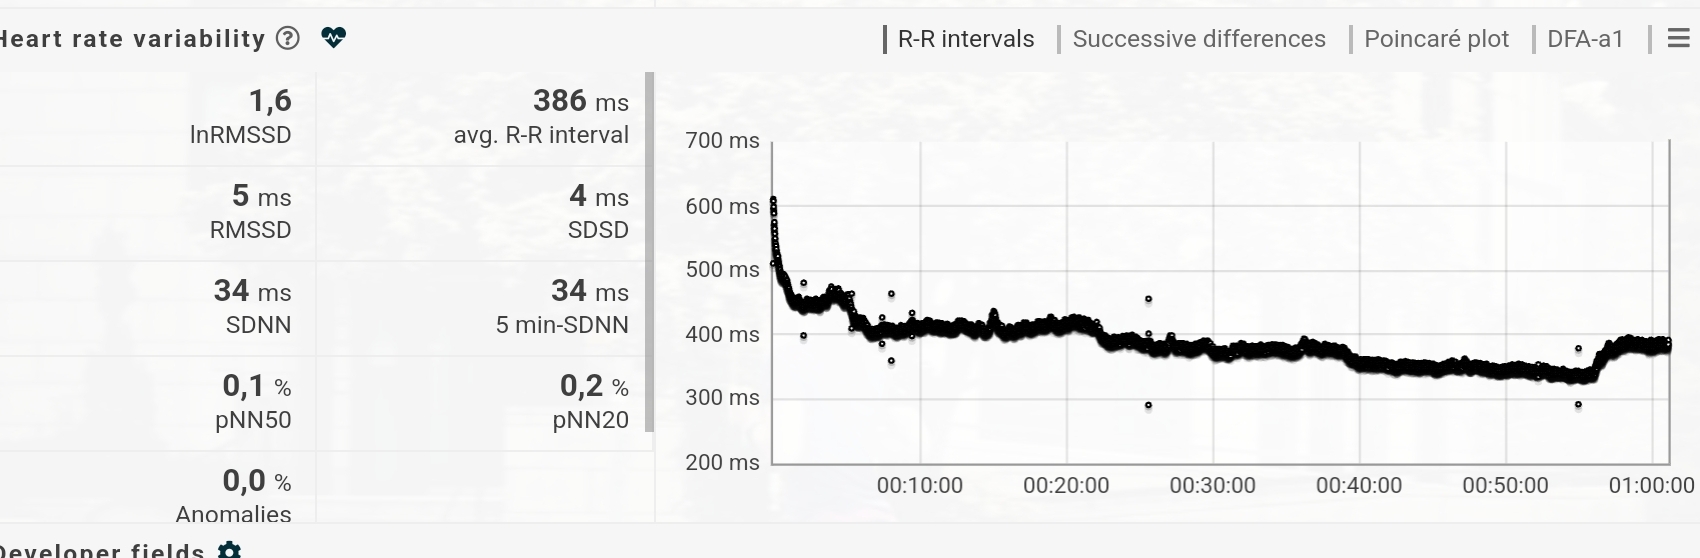
@althaea35 that’s odd, what sport and what HR strap are you using? There have been known cases where either a bad strap or sensor are not producing good quality HRV data. You can try to look at the % of anomalies in HRV recordings via Runalyze (https://runalyze.com)
E g. (0.3% is good)
-
@herlas Thank you for your response.
I have been monitoring the quality of the data using Runalyze for all runs, and the results have been good with low noise. Generally, I use the Suunto MoveSense strap, but have tried switching it up with a polar H10 for a few sessions to vary the data sources. The results show consistent trends, with a number of long threshold intervals and progression runs in the bag (I have posted results from another session earlier in this thread).
I am interested if there are outliers (physiologically) or maybe my baseline data is corrupt?
-
@althaea35 : I have the same kind of results in my graphs.
Would like to understand this also.
Using a polar H10 strap. -
@pilleus said in Suunto ZoneSense:
If this is the case and the baseline recalculated after the activity on Suunto servers is not synchronized into the watch, then the live display on the watch would be pointless for me …
actually this is what is supposed to happen: the baseline is synced back to the watch.
-
@Egika said in Suunto ZoneSense:
@pilleus said in Suunto ZoneSense:
If this is the case and the baseline recalculated after the activity on Suunto servers is not synchronized into the watch, then the live display on the watch would be pointless for me …
actually this is what is supposed to happen: the baseline is synced back to the watch.
Synced back to all watches? I use the Vertical and the 9PP with ZoneSense …
-
System referenced this topic on
-
@pilleus I would expect the ZS baseline to be updated as part of the SuuntoPlus sync step whenever you do a sync - assuming the ZS SuuntoPlus app is installed on the watch being sync’d.
-
Walking on a 13 % incline and running on a 3 % incline ️on the treadmill.
Intervals of 2 minutes walking and running. ZS also shows me a conclusive graph here.
-
Is there a way to increase the font size a bit? After a certain amount of time, I have trouble reading the values while running.
-
@iterumtenta no font size is adjustable in any Suunto screen, I’d like to see changes but we don’t know if it’s being considered unfortunately.
-
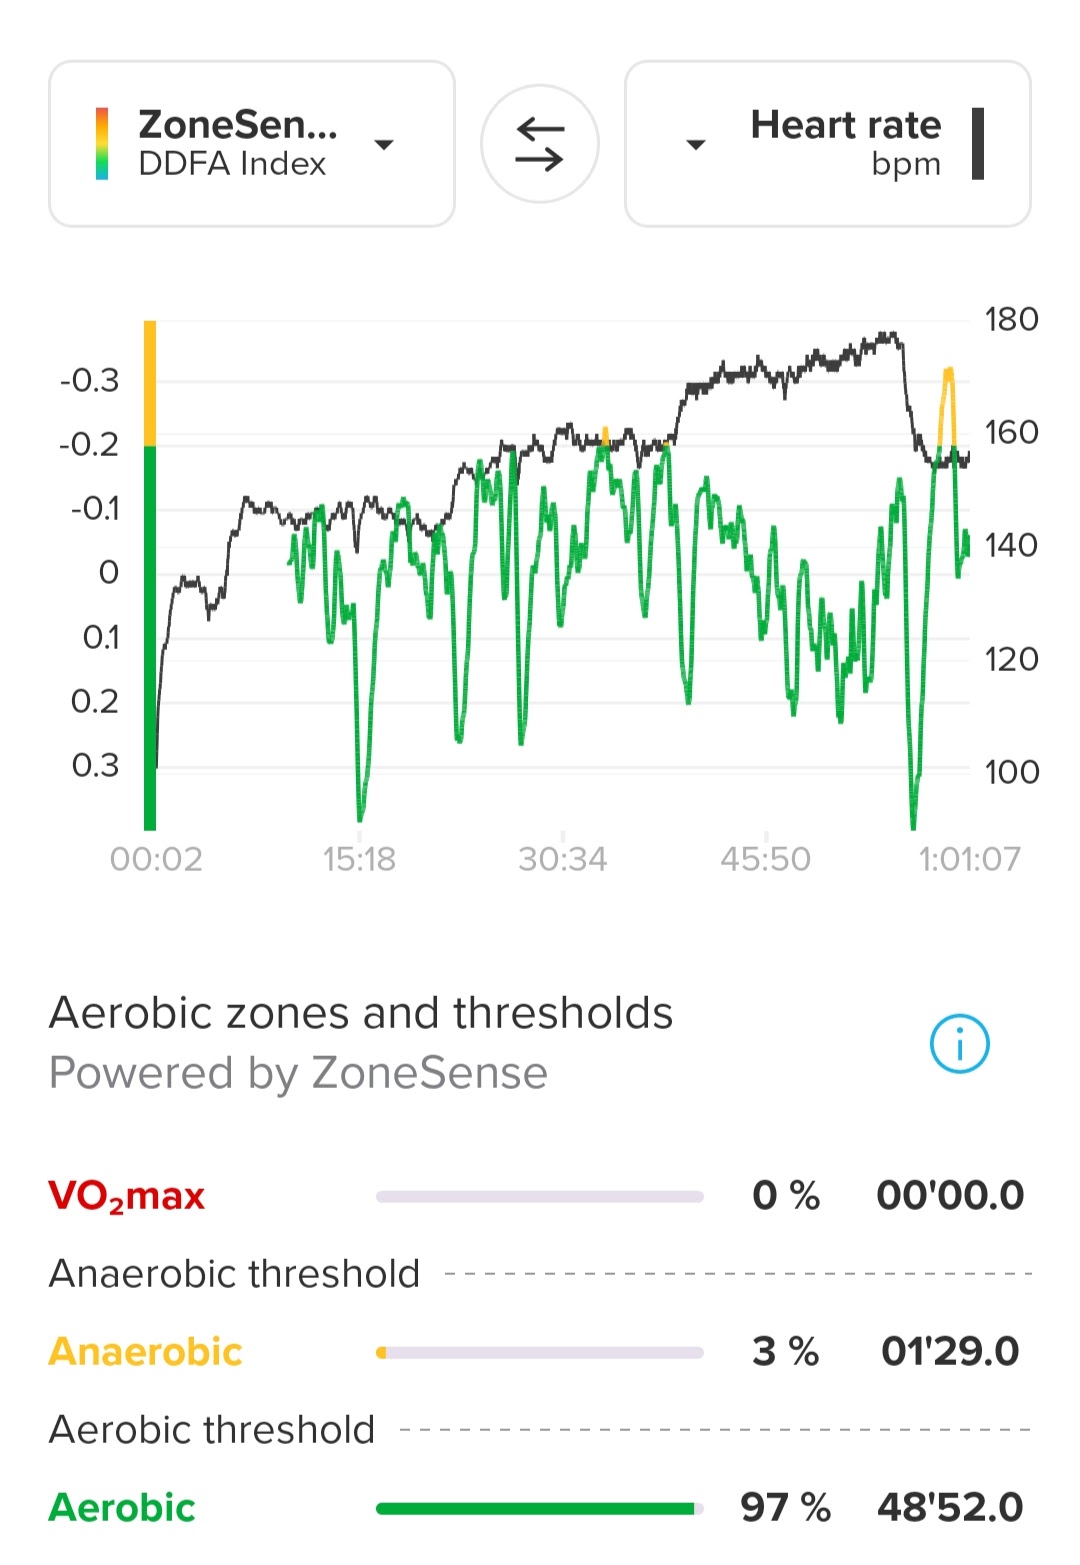
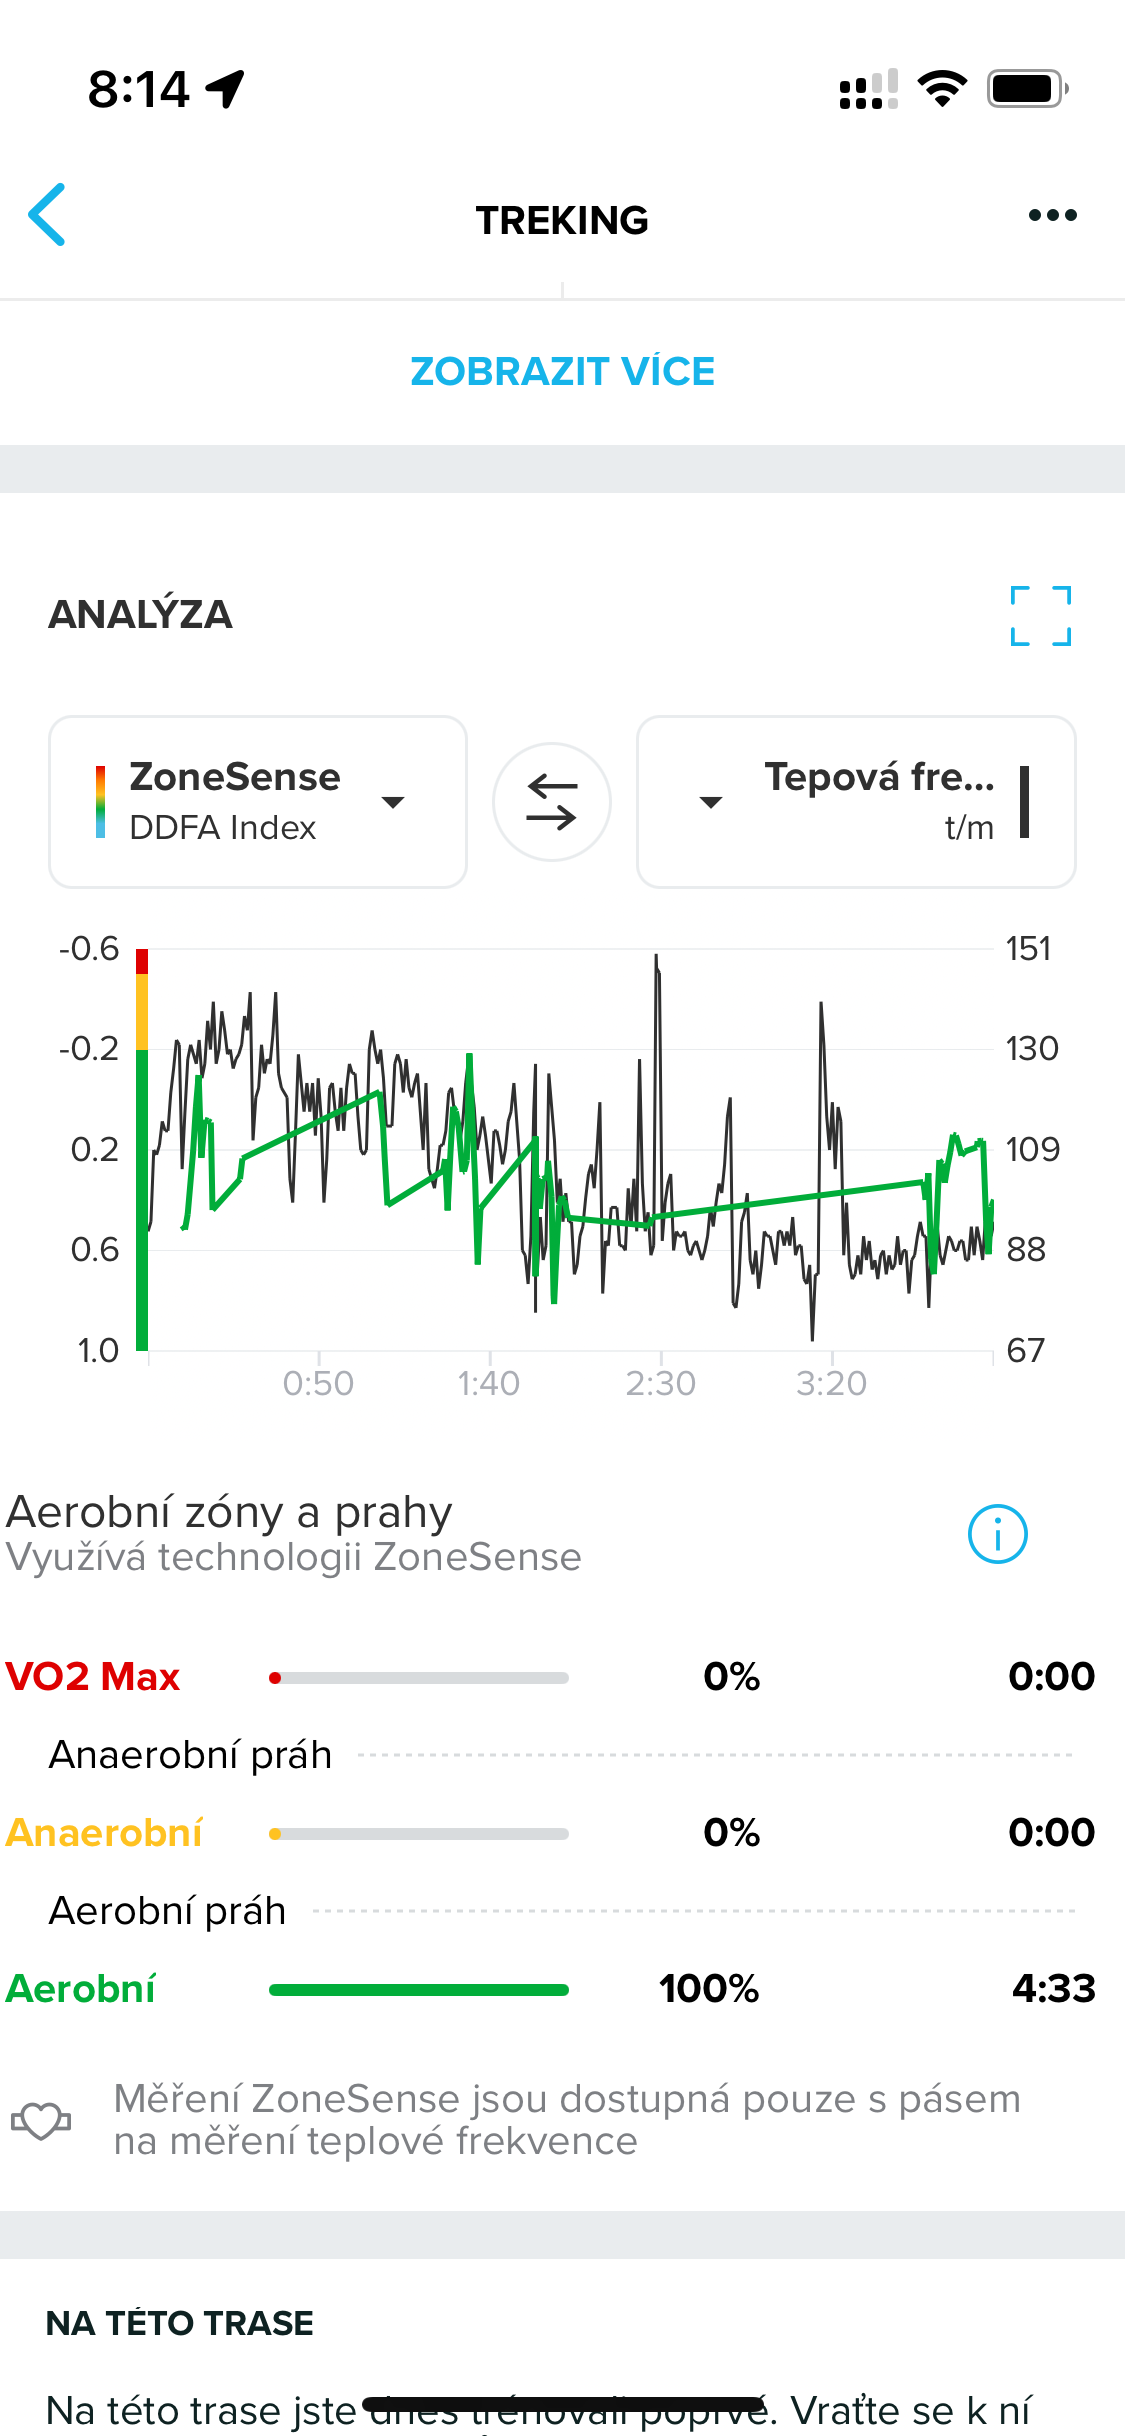
Hi friends, after some weeks of testing, I can’t find the connection between ZS in watch and app. On the watch it seems to work most of the time. APP shows nonsense 100% of time. I don’t catch this. If this should show us “real time effort”, what it does most of the time, why in app is not only the mirror what was measured by the watch. I saw here something about recalculating on the suunto servers but… really? How can be real time effort recalculated on the server? Then it can’t be real time… or? I don’t know guys, I think that this is very poorly explained.
If I don’t want to use it anymore, is there any possibility in the app to turn this thing off? It is always as default in the graph. I need to use strap for 100% activities if I don’t want to have absolutely random HR data, so in every activity I have this nonsense graph as default. In the watch it is easy, just don’t use S+ app.
Below example, it is like this 100% of time. In the watch there are some times measured in zones, in app 100% Z1. It definitely wasn’t")
It is good idea by design, but does not work yet, it should be presented as beta I think.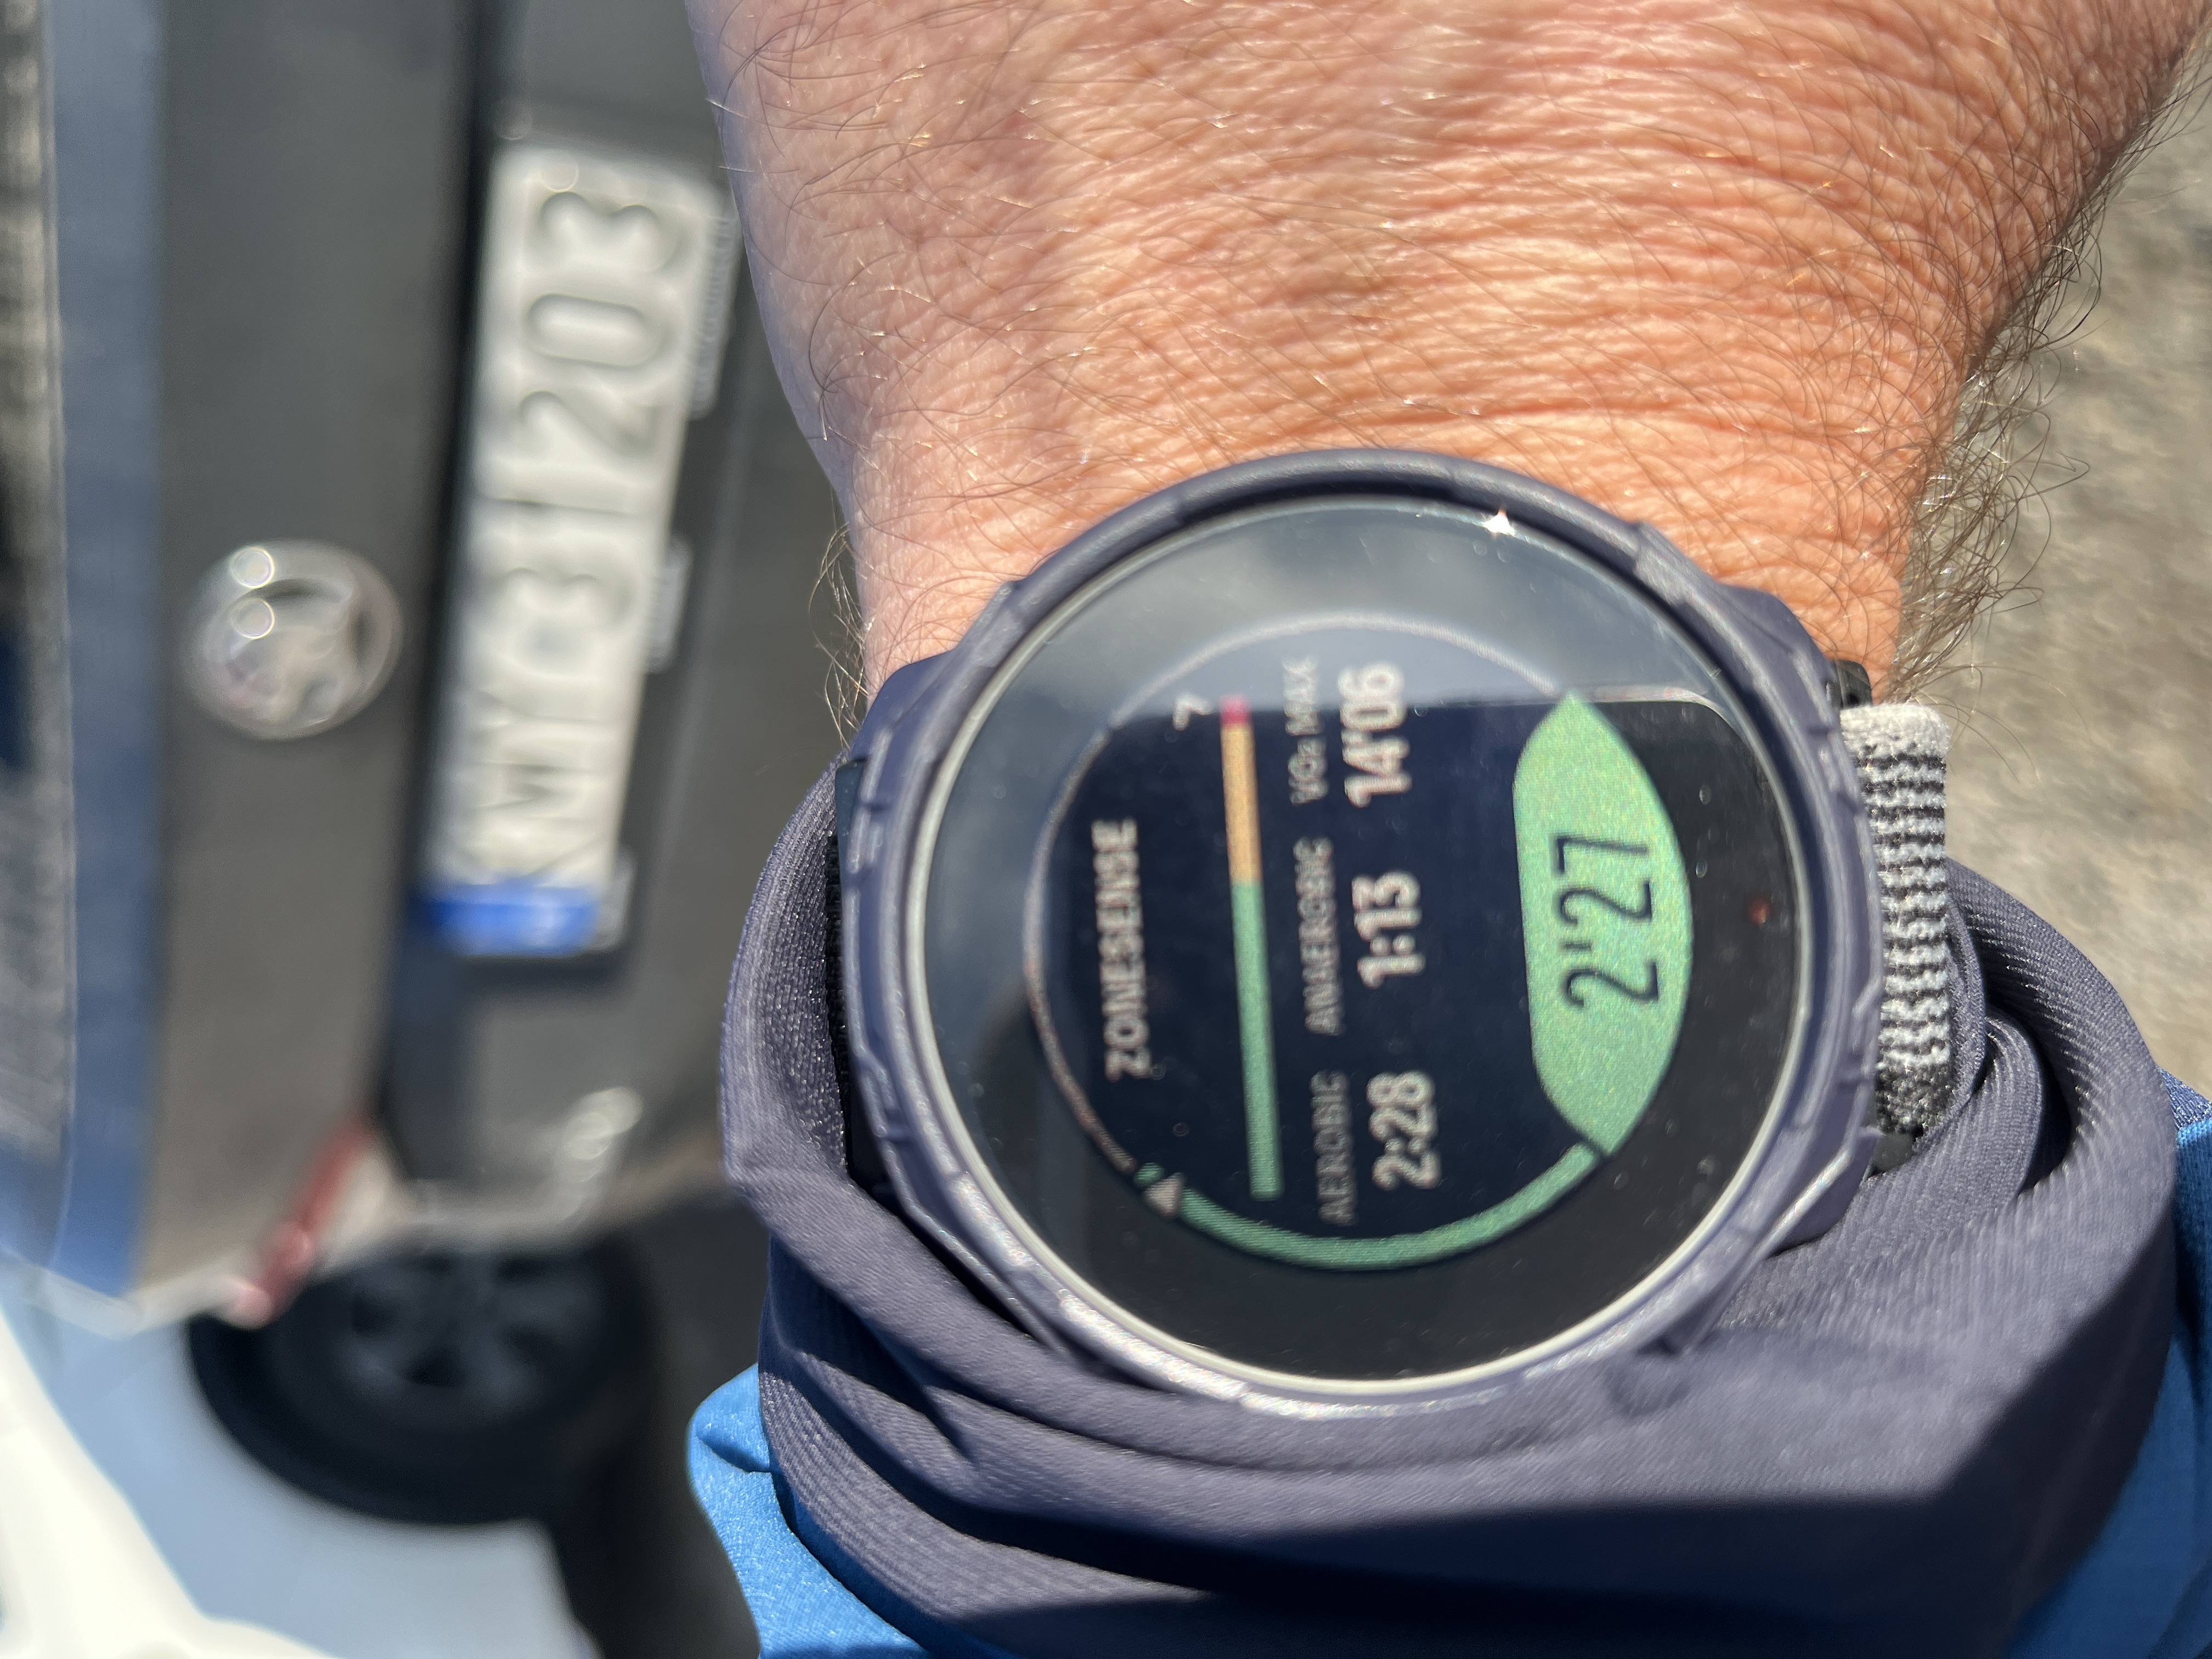
-
I use ZS too. For me there is a minimal difference between watch and app, but only in the summary of the times in different zones.
I have never seen such straight horizontal lines between two points as in your graph. I think that data are missing or bad in these areas?
-
@pilleus said in Suunto ZoneSense:
I think that data are missing or bad in these areas?
I also think that may be the reason. @AntoniusGaius you can check your data quality in Runalyze (requires free account).