Suunto ZoneSense
-
@Mff73
First of all, I’m not such a great physiologist, but I enjoy the product and ask to understand
When you perform an analysis of zonesens in the app, for example aerobic & anaerobic threshold appears.
And a certain pulse appears - for me, aerobic threshold is 125
When I pass the 125 heart rate shown on the watch I expect the watch to jump from green to yellow but it doesn’t happen right away sometimes the heart rate goes up a bit more until it changes
It is possible that it is slow to change is because every training session changes the range data??? -
@Danny-poleg
i am neither physiologic, and maybe i also totally misunderstand all this.
But,
it is said that zonesense is : not something for instant management not for quick/shot intervals.
Plus, it is said that zonesense is analyzing live RR data, thus from current workout, and thus trying to calculate current thresholds --> if you are not fit that day, tired, or not, etc… this context of current workout cannot be related to zonesense previous “indication”.
So, to my understanding : “you” should see globally now and in the future what zonesense is “suggesting” to you, and adapt (or not) your HRzone accordingly (if you still need/want to use those HRzones).And, again, i would like to be corrected by any experts, as it is just my own understanding of all this new thing.
-
@Mff73
The truth is, now that I’m reading what you wrote, it seems that you are indeed correct
What I will do now is write down the threshold data that appears in today’s training data and compare it to the next training I will do.
I, like you, would love to learn from the members here on the forum. -
@Mff73 I do not have first-hand insight into the actual algorithm used but ZoneSense much like other methods that try to make sense from a noisy input integrates over a certain timespan and thus requires some burn-in time and somewhat independently from it there is a response delay.
The figures at the moment are 10 minutes burn-in and a 3 minute time window mid-activity.The watch itself will discard the 10 minute burn-in data because it needs these to begin to find a pattern in the beat-to-beat interval data and again needs some time to adjust to major changes during the workout. It will not stop displaying data once it has tuned itself in but don’t expect strictly real-time responses. After three minutes or so at the new intensity the data will start making sense. Shorter intervals will trend in the correct direction (harder efforts will display higher ZS zones) but where you land precisely on that scale in absolute terms is computed more reliably on a minute and longer timescale.
-
@Christoph13 Thank you for this explanation. Where did you come across the 3-minute window? I’ve read through some of the documentation, but hadn’t seen this figure yet.
Anyways, it matches perfectly with what I have observed. I’ve been running short hill repeats recently of about 4-5 minutes each. I’ve noticed that ZS doesn’t start to spike until I’m almost at the top of the hill (3-4 minutes in). This now makes sense if it needs that 3 minute window to start throwing out the effects of the easier downhill and start building in the uphill effort.
I know ZS isn’t meant for these short intervals, but the simple idea that it’s calculating effort over a 3-minute window has made it easier to interpret the results I’ve seen.
I think Suunto is going to need to do a better job of explaining exactly what ZoneSense is and what it is not, how it works, and what users should expect from it. I know there’s documentation out there, but the average user isn’t gong to pour over any of that. I don’t know that I have any suggestions on how to do this. Simplifying such complexity is a challenge in itself.
-
@duffman19 there’s a nice video lecture from Suunto about ZS: https://youtu.be/bD3O4BZ9vIc?si=7CPMIx6Slnj79Q-i
-
@Danny-poleg said in Suunto ZoneSense:
@Mff73
The truth is, now that I’m reading what you wrote, it seems that you are indeed correct
What I will do now is write down the threshold data that appears in today’s training data and compare it to the next training I will do.
I, like you, would love to learn from the members here on the forum.To add to what @Mff73 said, ZS is not HR and is not meant to function as HR. Instead it is a real-time feedback on your effort if you have a newer watch. For example, if you did a long hard workout or intervals the day before your AT threshold in ZS is likely to be lower than your typical threshold. ZS is not necessarily meant to set thresholds but depending on the number and intensity of workouts should give you a good idea of where your zones are.
The power of the real-time feedback is to help you achieve the desired intensity for a workout or monitor intensity for a Race. ZS is already proving a game changer for me, my training and my racing!
-
@duffman19 Suunto have done this very clearly in the video @halajos linked.
-
@halajos @Brad_Olwin Yes, I watched that. I’m (somewhat) interested in the new metric and I barely made it through the video. That might say something about my attention span, but I’m gonna guess the average user isn’t going to sit through that.
I am aware there is a delay in the analysis, I just didn’t recall hearing the specific 3 minute window mentioned. That goes a long way to help my understanding of the post-activity graphics.
On the other hand, the ad produced by Suunto to introduce ZS does nothing to explain how the metric is derived. This is the video most users might see, if anything at all. My point above was that Suunto has a lot of work to do if they want ZS to be a selling point for their products. And this is evident by the many puzzled reactions from users in other forums.
-
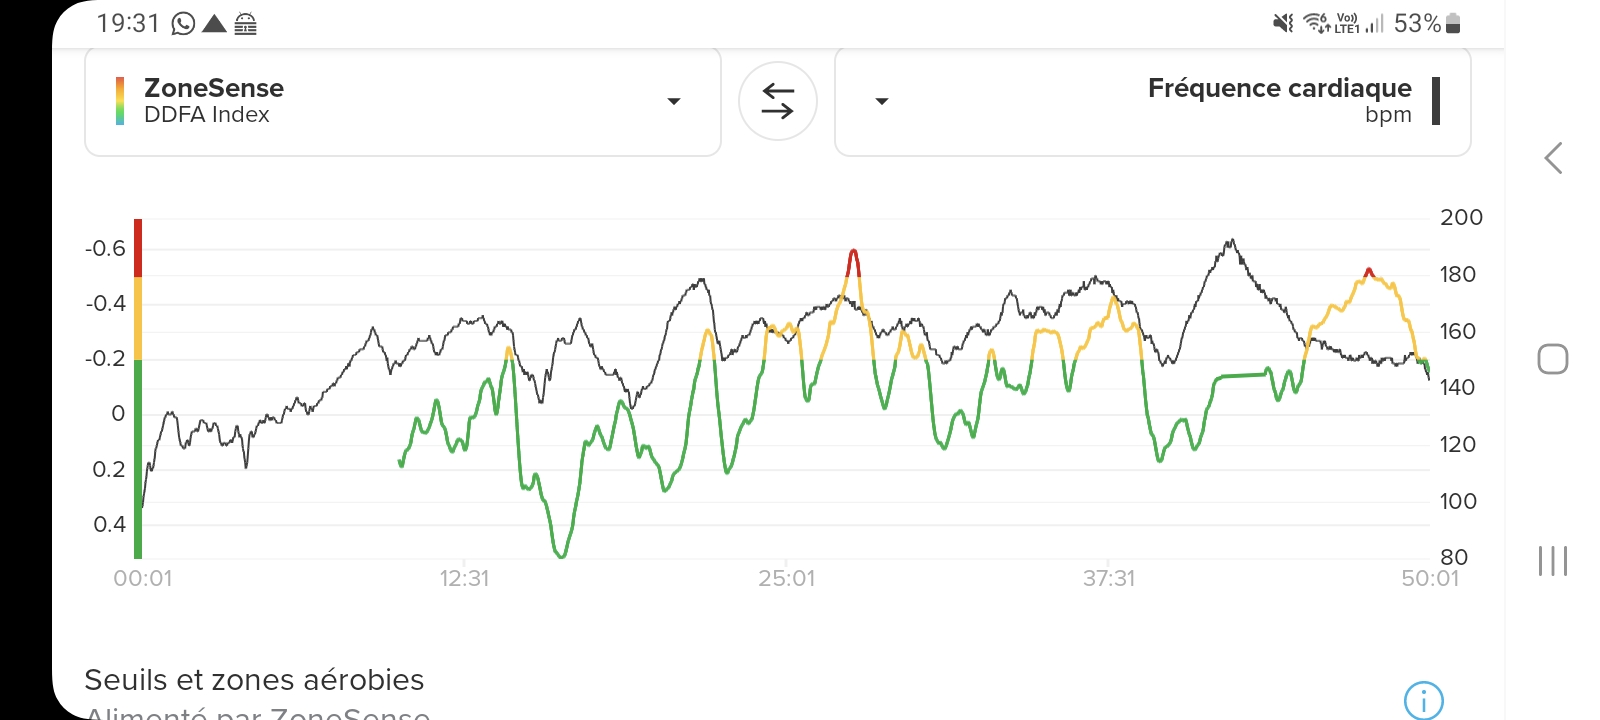
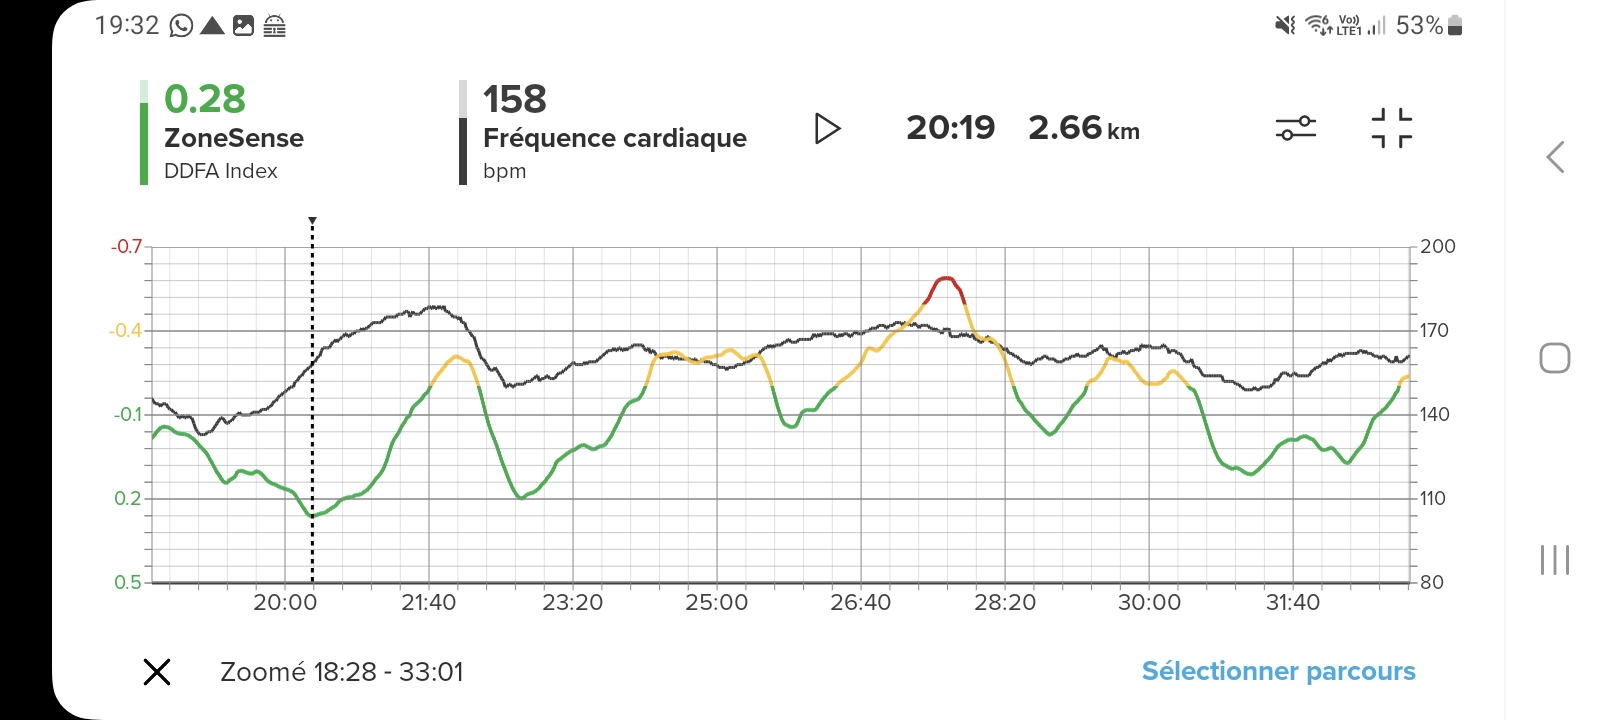
Maybe a graph bug.
One this graph, limit between aerobic and anaerobic seems to be at 150bpm
But on this one it is at 160 (same activity ofc)
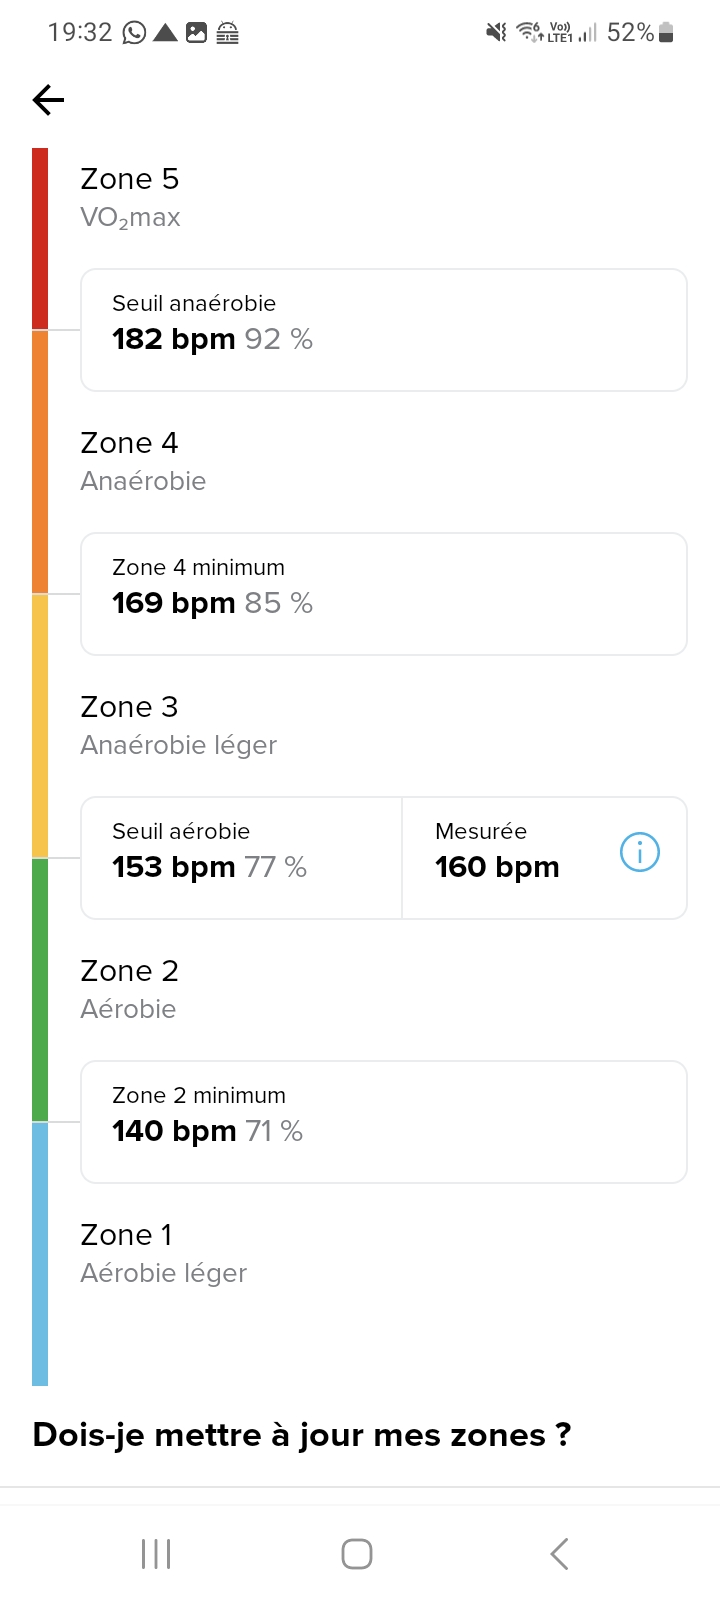
And correlated with AT proposal
-
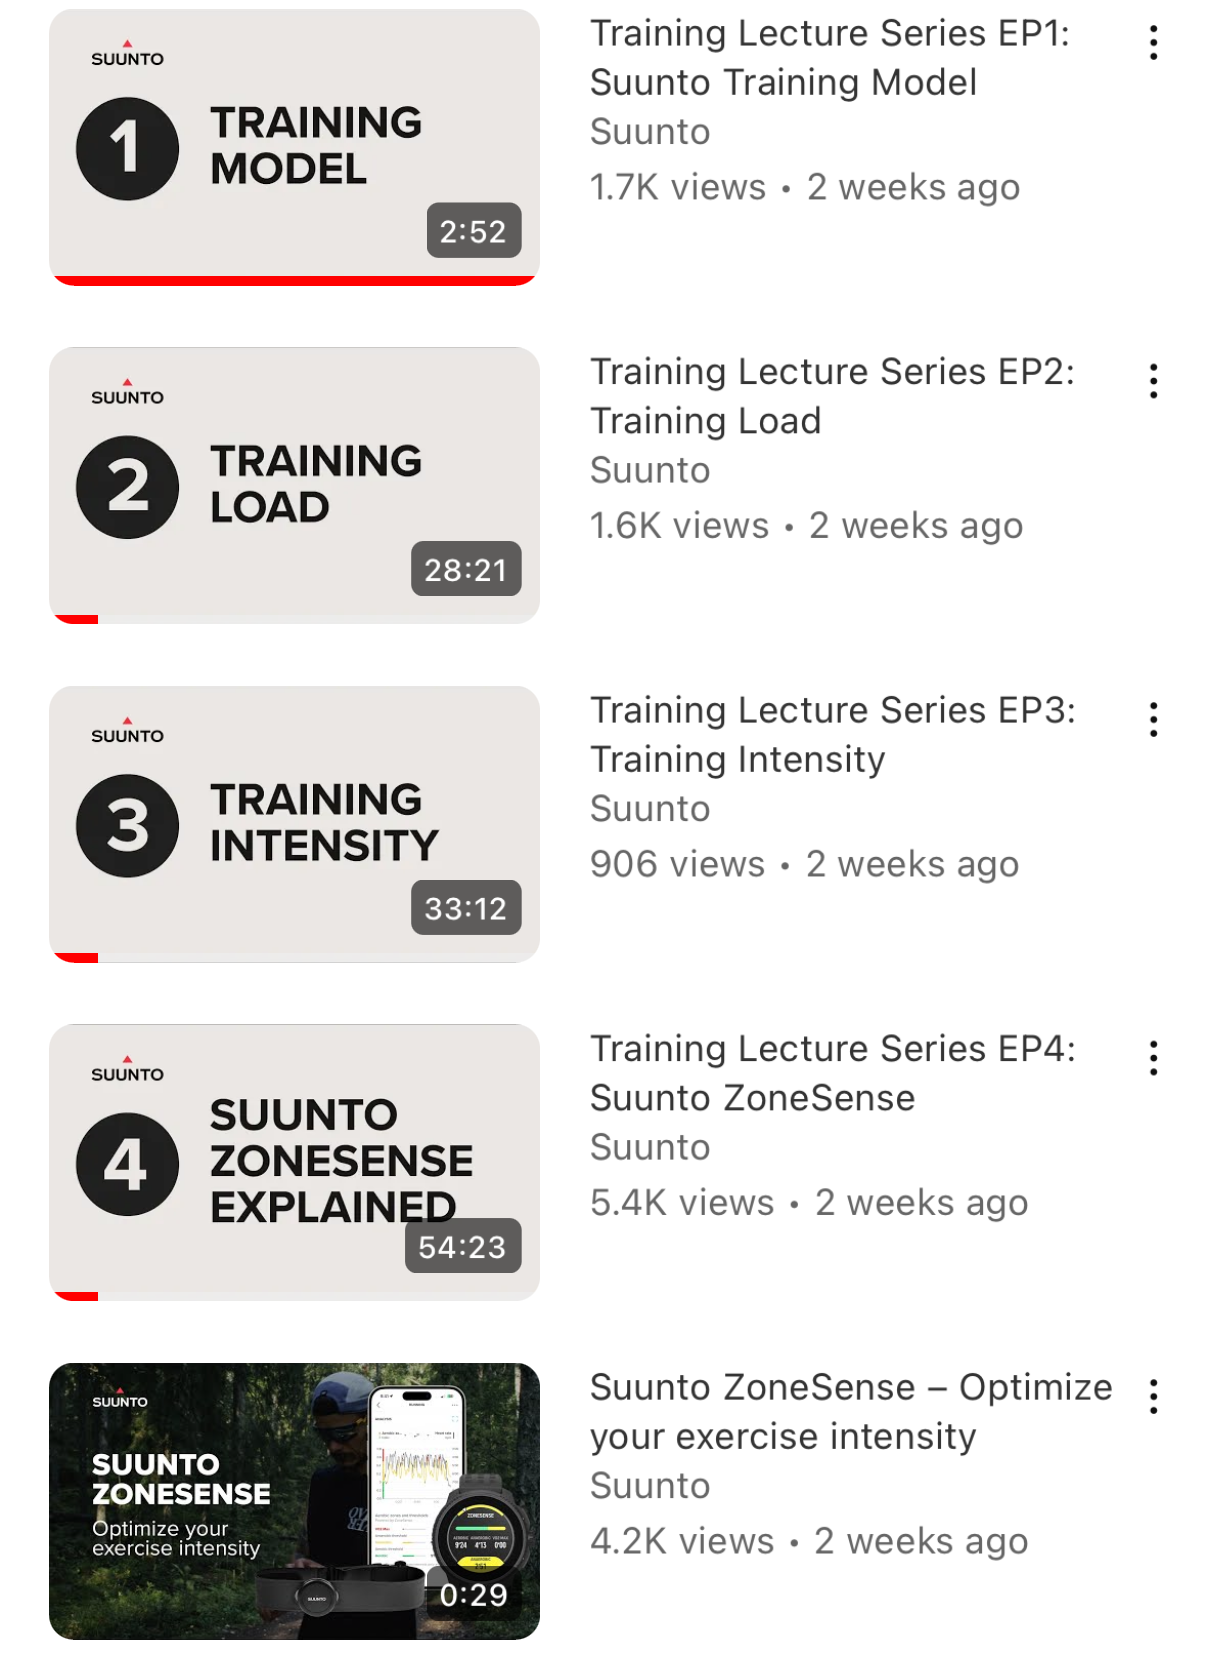
@duffman19 I’m with you: I love that they put the effort into explaining the new metric, unlike Garmin who might put together one page, somewhere, maybe… but the reality is very few people will watch one of those videos, let alone all of them. Case in point:
We are a species that worships little devices designed to support the attention economy, with the optimum length of a YT video being something like 12m.
Regardless of what point is made, somewhere, in a 54m video, it’s going to be unavailable most.
-
@Mff73 I don’t think that the ZS axis (on the left) is to be correlated with the axis (on the right) of the second metric selected (here is HR, it could be something else, elevation etc).
-
@mlakis
Omg, but you are right , I feel stupid now.
  .
. -
@duffman19 said in Suunto ZoneSense:
I think Suunto is going to need to do a better job of explaining exactly what ZoneSense is and what it is not, how it works, and what users should expect from it.
I guess someone at Suunto was already on top of this. Their last two IG posts have done a decent job of boiling down the basics of ZoneSense. I think they forgot to mention you need an external HR strap, though. Whoops.
https://www.instagram.com/p/DAlHQyVJMgu/
https://www.instagram.com/p/DAsfQjRN0In/ -
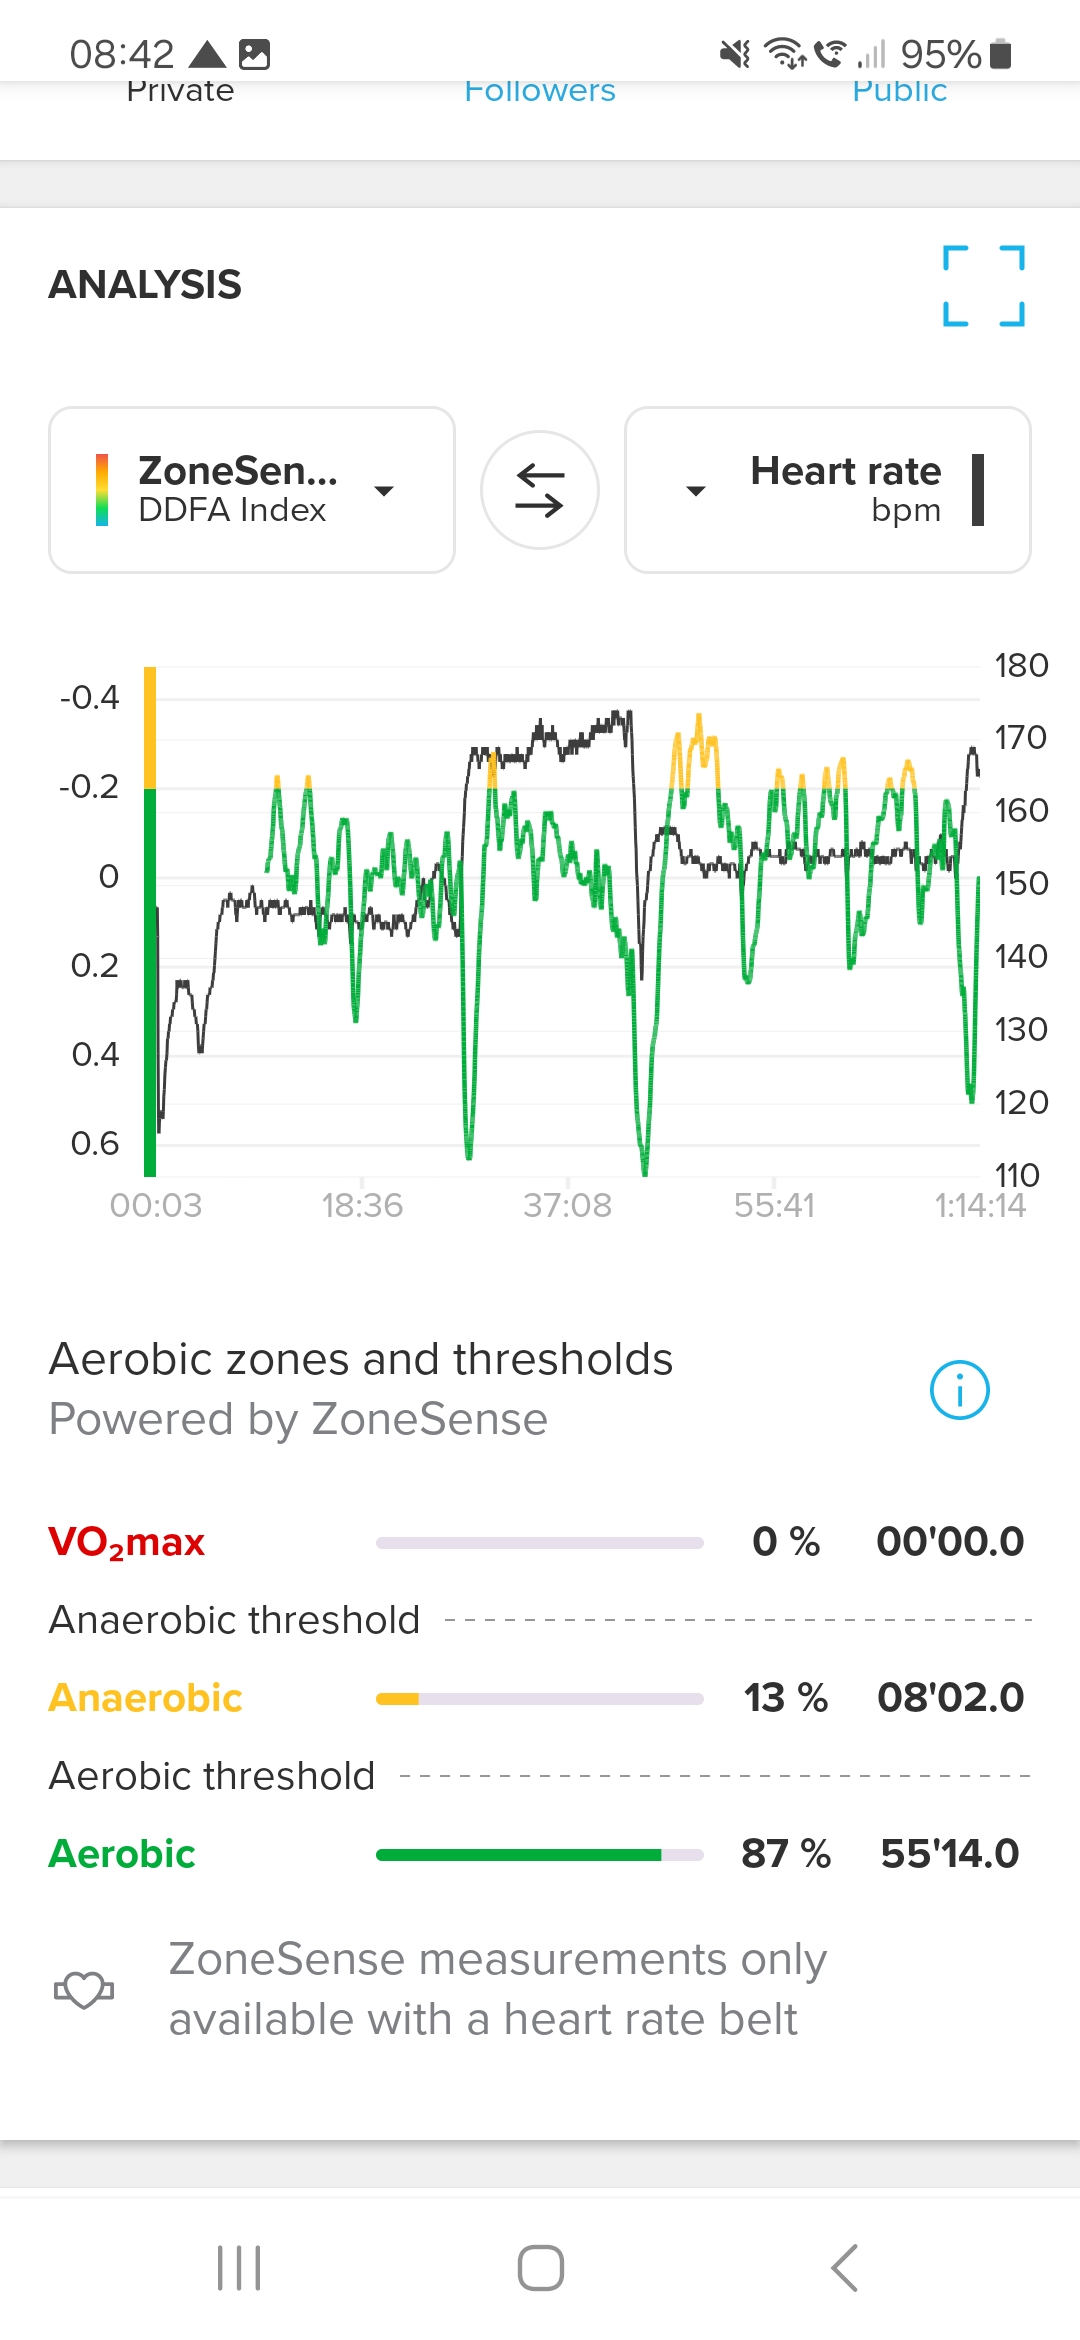
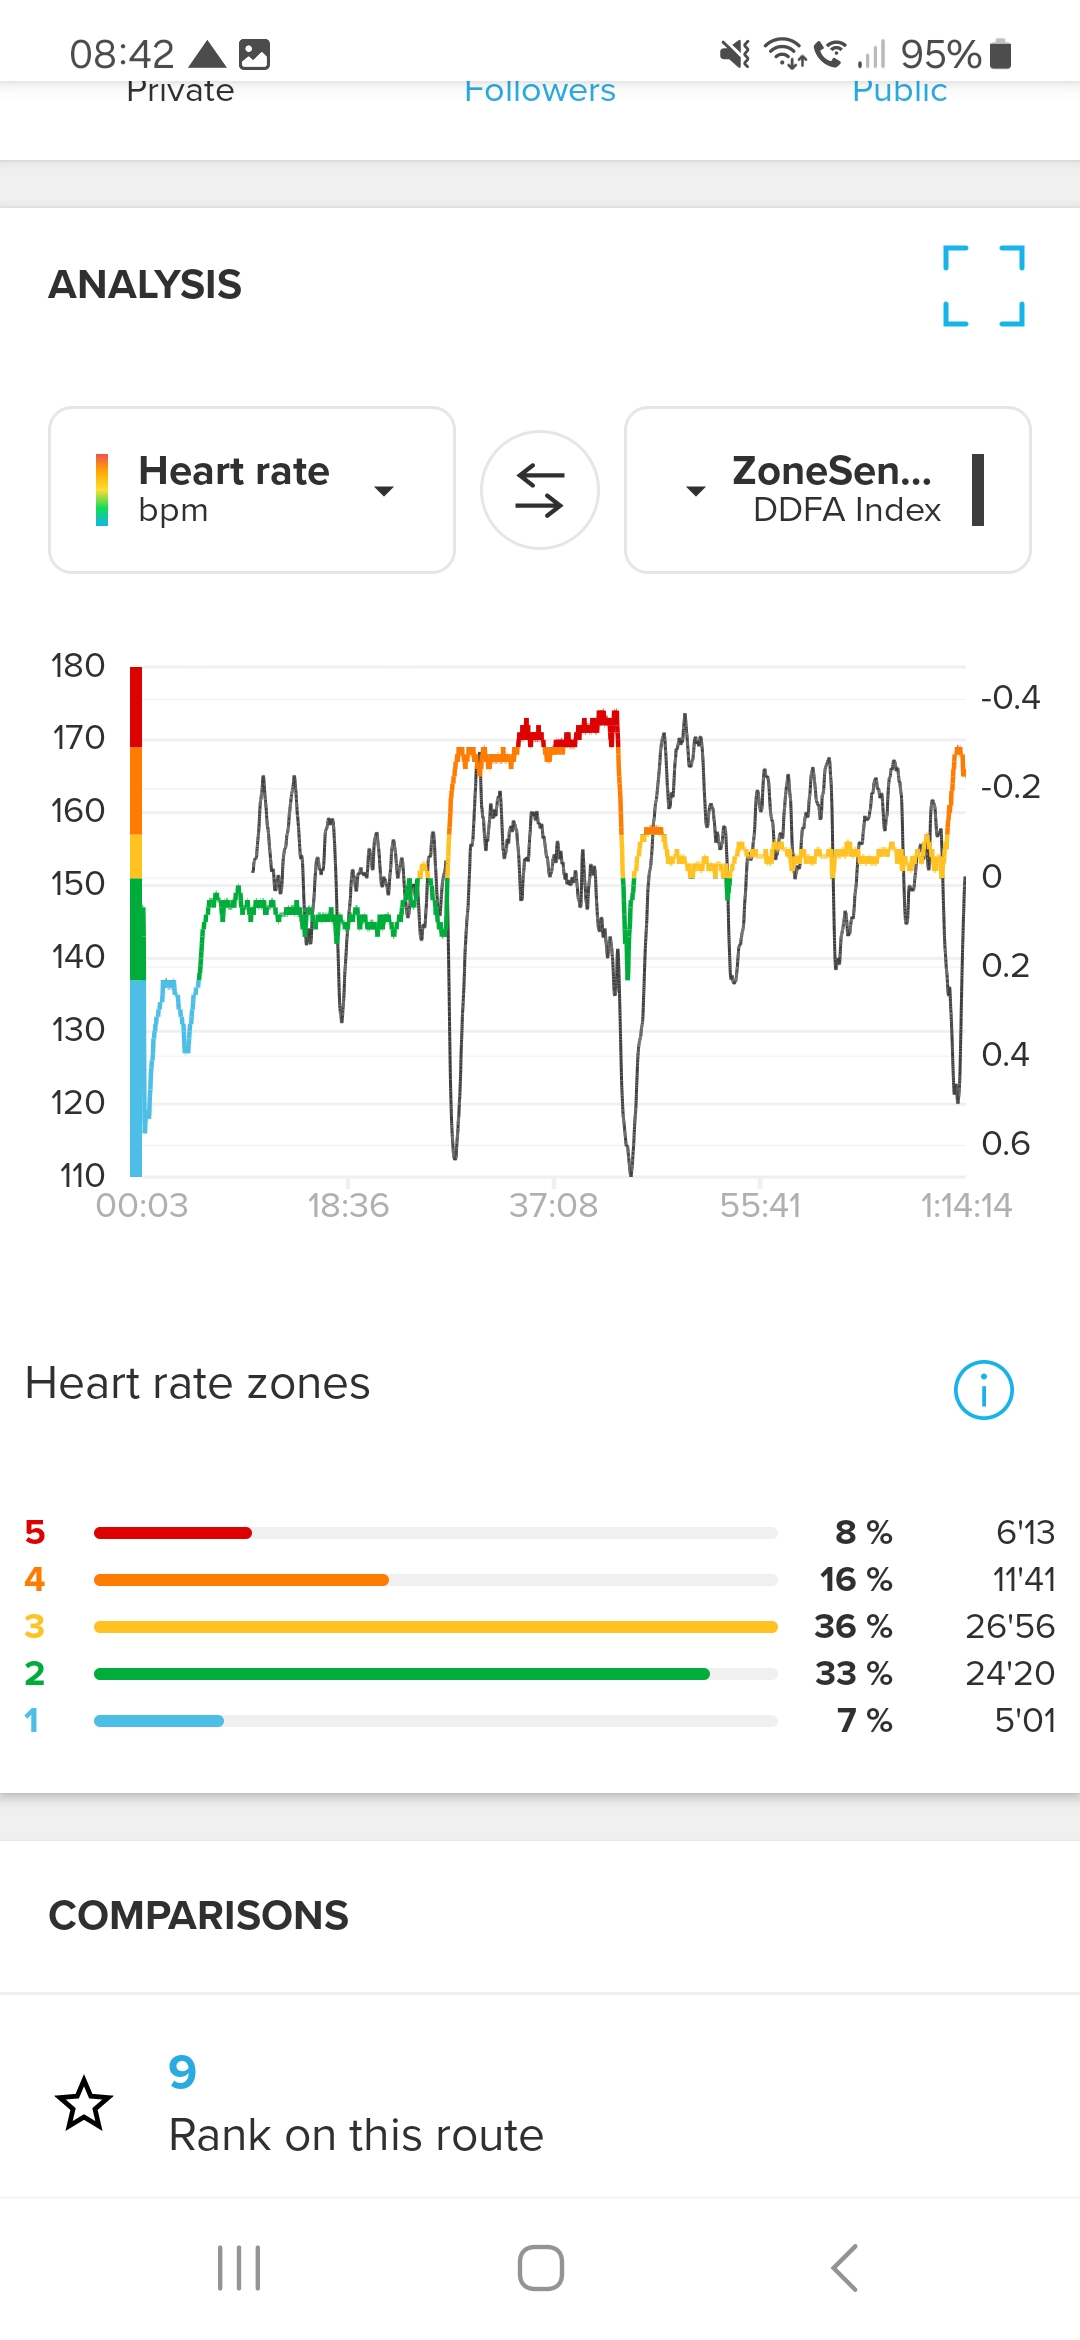
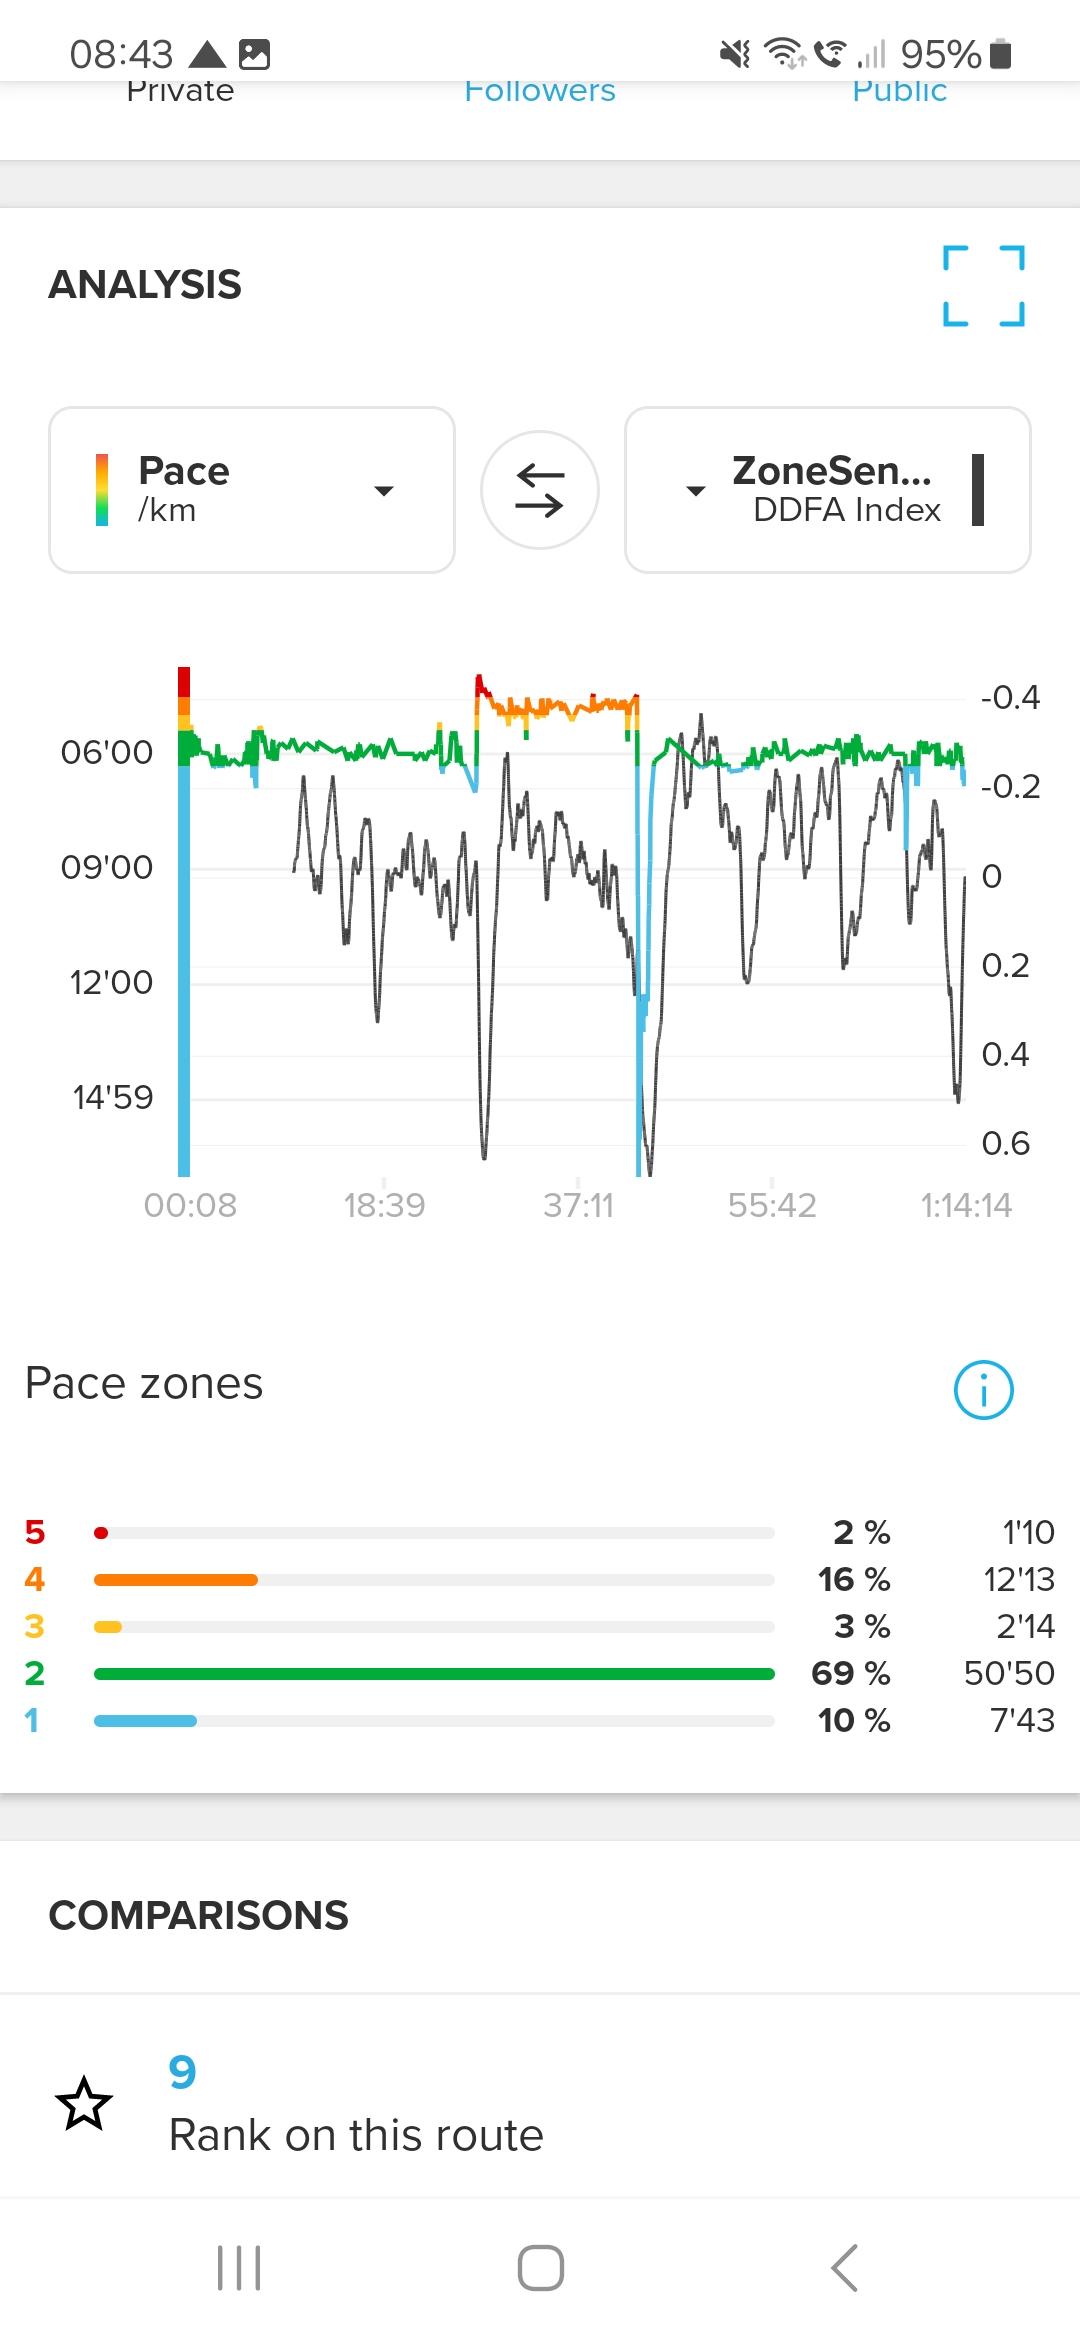
@Brad_Olwin I have been using ZoneSense to help pace my longer aerobic runs quite successfully, but today I did a 3 km assessment effort sandwiched between longish aerobic efforts. I feel that if I used ZS to pace my effort today it could be problematic.
Counter intuitively my ZS reading continued to fall into the ‘green zone’ as the very hard effort of the 3k progressed. Using Runalyze I have determined my HRV data was very ‘clean’ and my subjective feeling aligns to my heart rate.
Any thoughts?
-
I have noticed that the ZoneSense DDFA index values are displayed in the range 99-101, although the graph here in the screenshots in the forum shows values with “0.x”. Does anyone have any idea why this is the case? I also can’t explain why the training is classified as 100% aerobic, even though I trained in higher heart rate zones? Does the algorithm need to learn more here?


-
I have noticed that the ZoneSense DDFA index values are displayed in the range 99-101, although the screenshots here in the forum show values with “0.x”. Does anyone have an explanation for this? Also, I can’t explain why the workout is classified as 100% aerobic even though I trained in higher heart rate zones? Does the algorithm need to learn more here?


-
Not related to your case, but it has been posted in Suunto FB groups there is a bug in ios and the fix is on the way.

-
@althaea35 Did you have the S+ app running on the watch? Mine today showed VO2M efforts but not on the app.
-
@Brad_Olwin Hi Brad yes it was running on the watch and from memory reflects what is showing in post analysis in the app.
For the life of me I haven’t been able to get the S+ app (or post analysis) into the red zone or even stay prolonged in the yellow zone. I would’ve hoped prolonged threshold efforts would take me there.