Suunto ZoneSense
-
ZoneSense relies fully on R-R interval data, therefore very reliable R-R interval measurement is required for it to work properly. I’m also using Runalyze to look at my exercise data, which has a chart for R-R over time. It clearly shows when the data is good or bad. Even if the R-R data is bad, our watches and SA show reasonable HR values, but it doesn’t mean the data is suitable for ZoneSense. Anyone experiencing discrepancies between the “correct” intensity based on lab test or feeling and what ZoneSense shows, might need to look at the raw R-R data first. May be that the HR belt is a candidate for replacement.
-
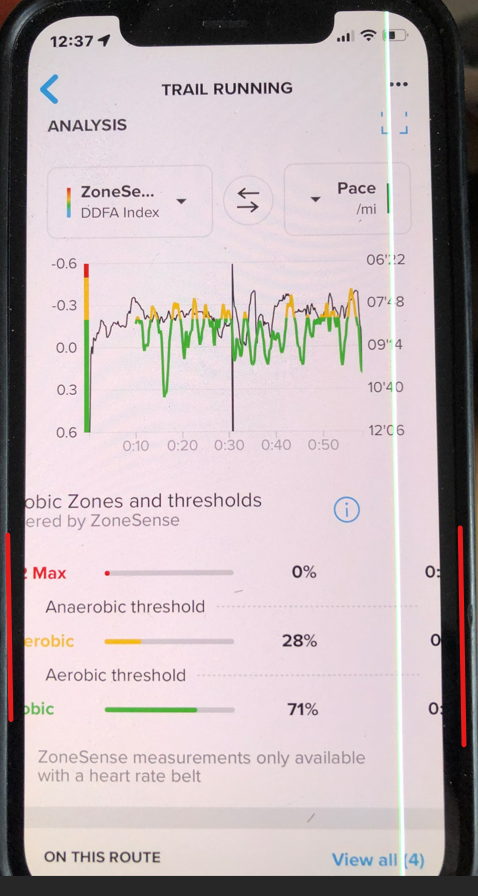
@Danny-poleg when exploring an activity, I can select ZoneSense from the list of metrics to display in the graphs. Then I can click the blue info button under the graphs and the measurement is displayed next to the zone info.
-
@Zdeněk-Hruška I hear you
 In the end I resort to to feeling to figure out whether I am stressed. And I know that metrics do not necessarily match what I feel. In both directions actually… I mostly do sport for recreational purpose. So TSS is a good way to safe me from myself and not so much finding the perfect load.
 -
@borgelkranz
Thank you very much
I just checked the only workout I performed with ZONESENS, the data corresponds to the heart rate ranges that the cardiologist determined for me in the stress test I performed - I entered these heart rate ranges in the watch
I will check tomorrow after a long run if there is a change -
@Raphes67 said in Suunto ZoneSense:
My first run with this new function didn’t deliver the results I was expecting, but I’m going to test it out again on my next runs.
On the other hand, I think Suunto should simplify the data display, which can be confusing.
Before doing the “Anaerobic threshold” test, I had an estimated lactate threshold of 153 in the watch’s CTL view. This seems low to me (max at 184). After doing the test, my threshold is 177. Big difference and a significant impact on the zones. I hope Zonesense will help me see things more clearly, otherwise I think I’ll just go for Karvonen’s zones.Hey i dont have Treshhold values in the CTL widget. Never ever, No day until i got my watch…
-
Well, I stil can’t find ZoneSense in my Android App (V4.100.4).
I know it only works on activities with a HR Belt, but my last few activities have been multisport (with a Suunto belt). Does it wotk with Multisport?
I have looked in several Multisport activities, and there is nothing in the App in the position seen above (i.e. just under Analysis in the Activity).
I have logged out, closed the App, Restarted, Logged back in, still nothing.
I have been back to what I think were single activities with a belt, but still no ZoneSense.
So what am I doing wrong / missing?
-
Anyone else’s Zonesense data not fit on the screen in the App ?
iPhone12
IOS Version 17.7
-
@Mattg576 same here… it looks like it slipped to the right
-
@SvenSchroeter @Mattg576 for the phone app, please discuss it in the proper section of the forum
-
@Mattg576 said in Suunto ZoneSense:
Anyone else’s Zonesense data not fit on the screen in the App ?
iPhone12
IOS Version 17.7
The First 10 minutes from workout there is collect the baseline. Cause there the graph is Starting later in the screen
-
@SvenSchroeter said in Suunto ZoneSense:
@Mattg576 same here… it looks like it slipped to the right
The First 10 minutes from workout there is collect the baseline. Cause there the graph is Starting later in the screen
-
With this new feature, we have proof that data can be analyzed post activity, without wearing the watch to display information in the Suunto App (even for older models).
Why not reproduce this principle for other metrics such as run/walk/stop time or calories burned or others ? -
@Raphes67 we always knew you can do almost everything post-activity in the app, but most people want features on the watch in real-time, not just after

-
@isazi Given the 2 Suunto Plus App limit, I was thinking that for a trail ride, for example, I’d want some live metrics (why not ZoneSense, hydration reminder, or whatever) but once the activity is over I could display the cumulative run/walk/stop post-activity.
-
Does it work correctly for people with LBBB or left bundle branch block? And data on that?
-
@Raphes67 to be honest, I think that the walk/run/stand information is more useful after (for statistical reason) than during an activity

-
Is it really useful for a mixed 2 hour cycling workout where HR oscilates between 100 and 130 with occasional 130 - 150? Or it should be used only on steady pace and HR?
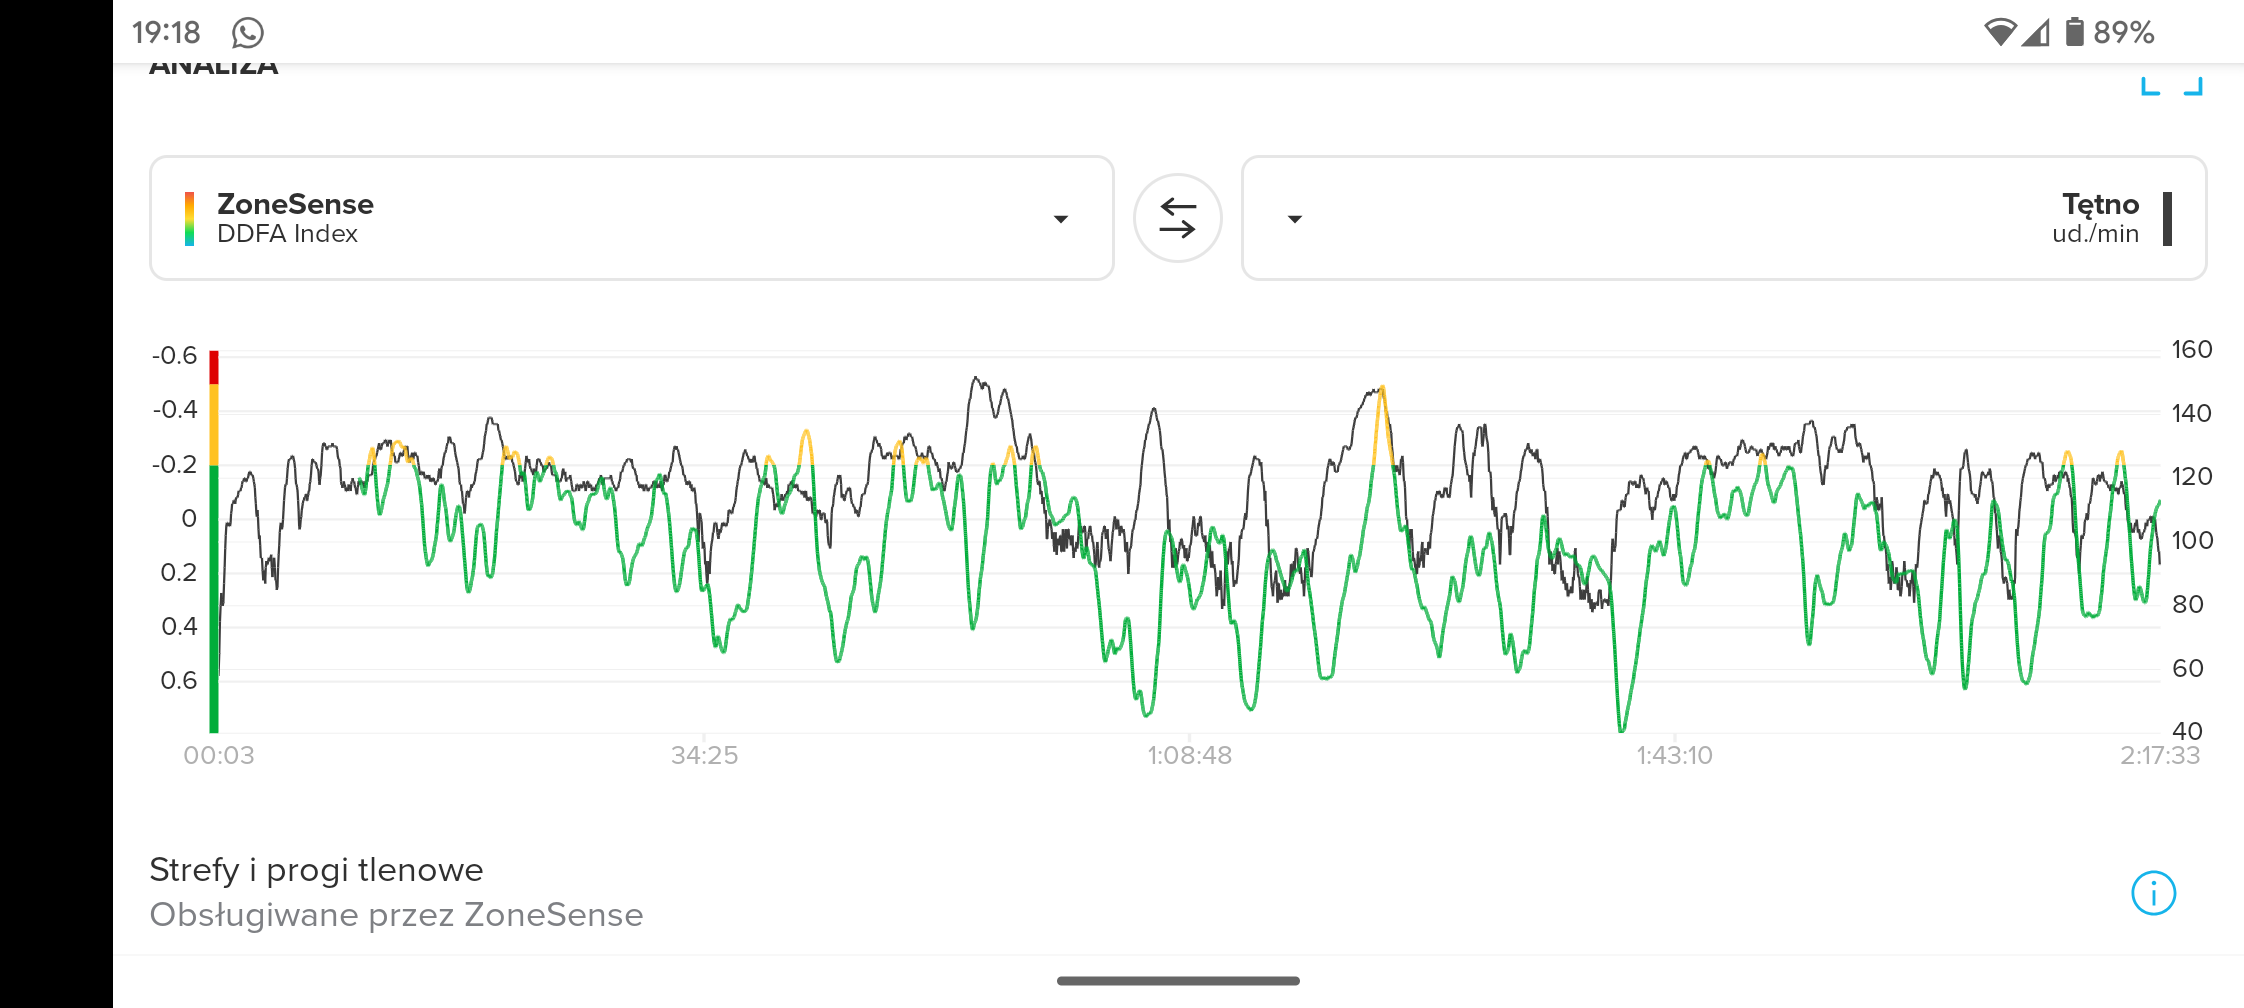
I’ve been observing strange behaviour which can be also seen on the post workout graph:

The zone sense mirrors the rise in HR but on the negative side. When my effort rizes, zone sense falls.
Even considering the lag (which I understand) - this is quite strange as I’ve been cycling everyday for the last few days and I feel tired, which is reflected in my aerobic threshold falling down from 121 yesterday to 115 today, but:
Considering that I’m on 115 today, most of my workout should have been in anaerobic, but zone sense mostly indicated aerobic.
What am I missing?
-
Don’t know if it’s been noticed already but top button on zonesens app screen changes data displayed :
- main datas : duration in every zone
- instant pace / instant bpm
- instant power / instant bpm
- total elevation / total descent since beginning
Makes app much more useful to me
-
@isazi I couldn’t agree more, hence my comment. Normally, without using the ultra-walking application, we wouldn’t have access to this type of information, even though it’s there and could be generated post-training.
-
@Tieutieu yep and you could change data displayed in the settings of the s+ app
I have hr/Ngp for trails it is huge