Suunto Routeplanner
-
@Mff73
Importability.
The reference is the A (rte) file. (Original).
Do file B to G import as well ?
“I am most curious about the B (trk) result”- If succesfull than next
Routability.
Do files B to F show the TBT as well or not ?
If nok than test STOP and over and out
If ok than continue with a more complicated (multioverlap) track
- If succesfull than next
-
Hello @kemetter !
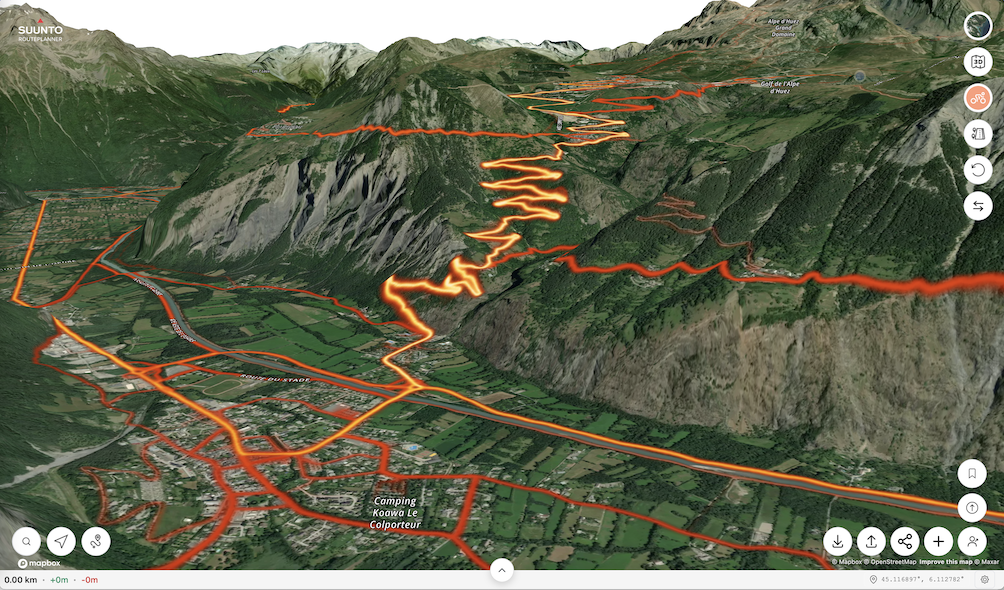
This is a great app for viewing and creating routes on a larger screen. Would it be possible to add a route generator that lets you enter parameters like “duration,” “distance,” and “elevation gain”? -
@Mff73
Import of gpx (trk)tracks in the Suunto Web Planner is positive.
Simple compare by “manually” adding the tbt data in trackpoints.
Manual edit prone to “typos.” In previous files one right should be left.
- Out-and-return overlap track test file series.
Observe compare and study, open in Notepad++
1A_Suunto out and return rte.gpx
1AA_Suunto out and return trk.gpx
1B_Suunto out and return navtrk.gpx
1C_Out and return navtrk.gpx
1D_ A small file sized compressed gpz version is possible
The upload of gpz or zip files is not possible in this forum
1E_Out_and_return_course.tcx
1F_Out_and_return_course.fit
The Suunto gpx extension only adds the via trackpoint bindings.
I seriously doubt this is sufficient for 100% TBT reliablility.
In the previous simple track the Suunto TBT generation is correct.
In the out-and-return track the Suunto TBT generation is incomplete.
Specifically 2 TBTs in the overlap return track section are missing.True Track TBT file modes.
https://github.com/osmandapp/OsmAnd/issues/14147#issuecomment-1114034225 - Out-and-return overlap track test file series.
-
Planning another long run of ~35 km, give or take. As expected, the Suunto Route Planner has non-uniform spacing between distance ticks on the x-axis:
- 0 km
- 1 km (+1)
- 3 km (+2)
- 6 km (+3)
- 8 km (+2)
- 13 km (+5)
- 16 km (+3)
- 18 km (+2)
- 24 km (+6)
- 33 km (+9)
- 35 km (+2)
This gives a skewed view of the elevation profile:

Compare to the uniform spacing using onthegomap.com:

Suunto Race S / 9 Baro / Ambit 3 Peak / Observer
Polar H10 / Verity Sense / OH1
Stryd Duo / Wind
r/suunto mod -
@atoponce Yes, I can confirm this strange behaviour.
-
@atoponce same here

-
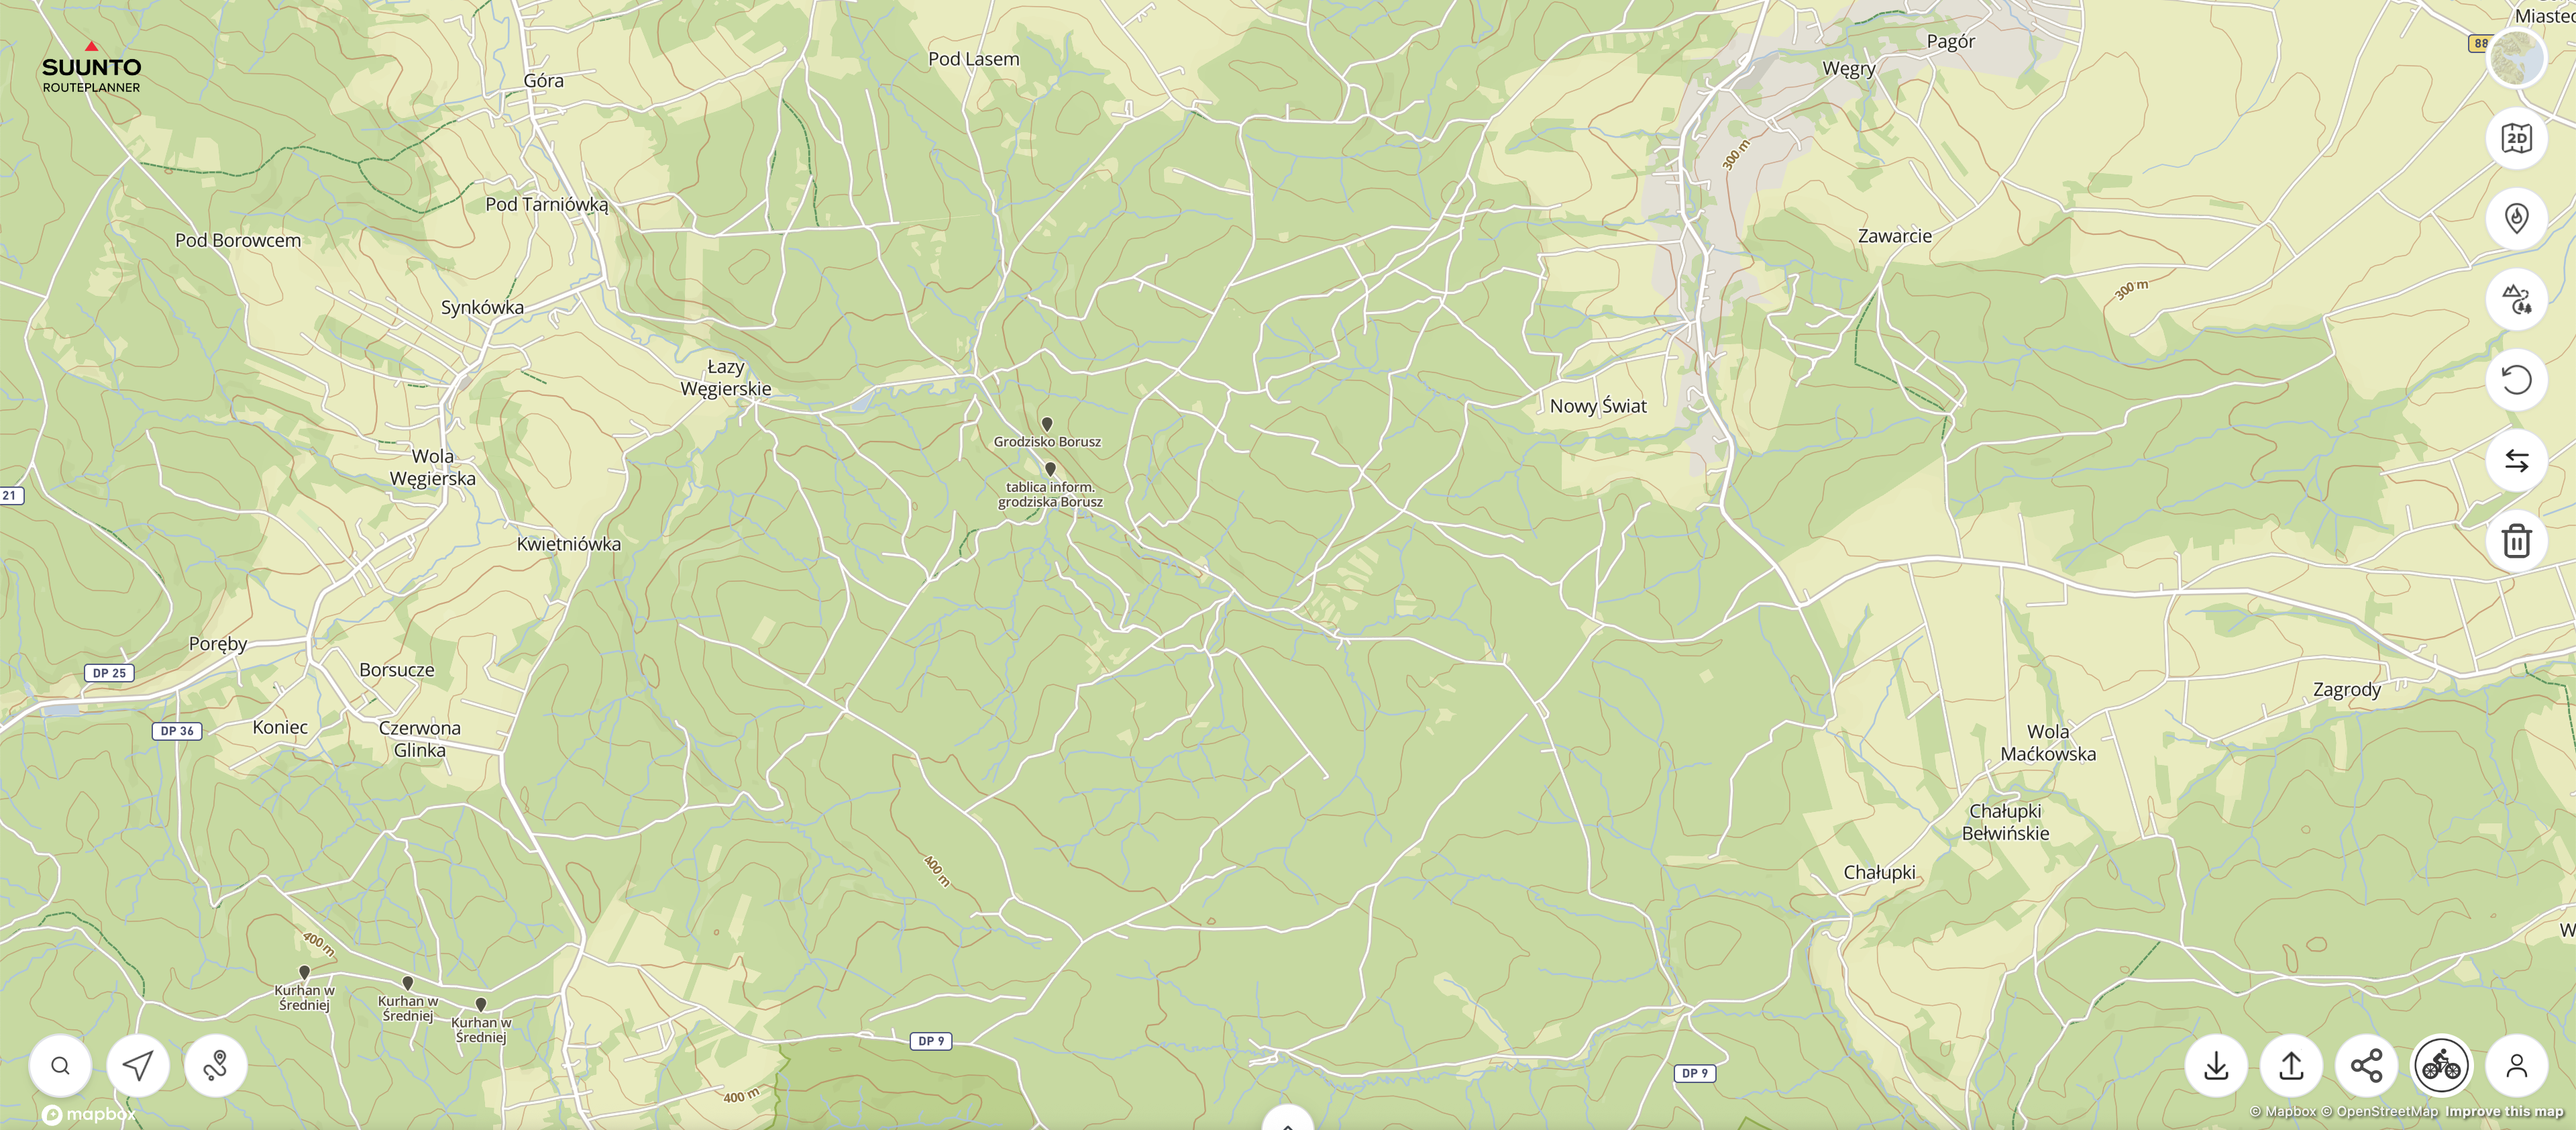
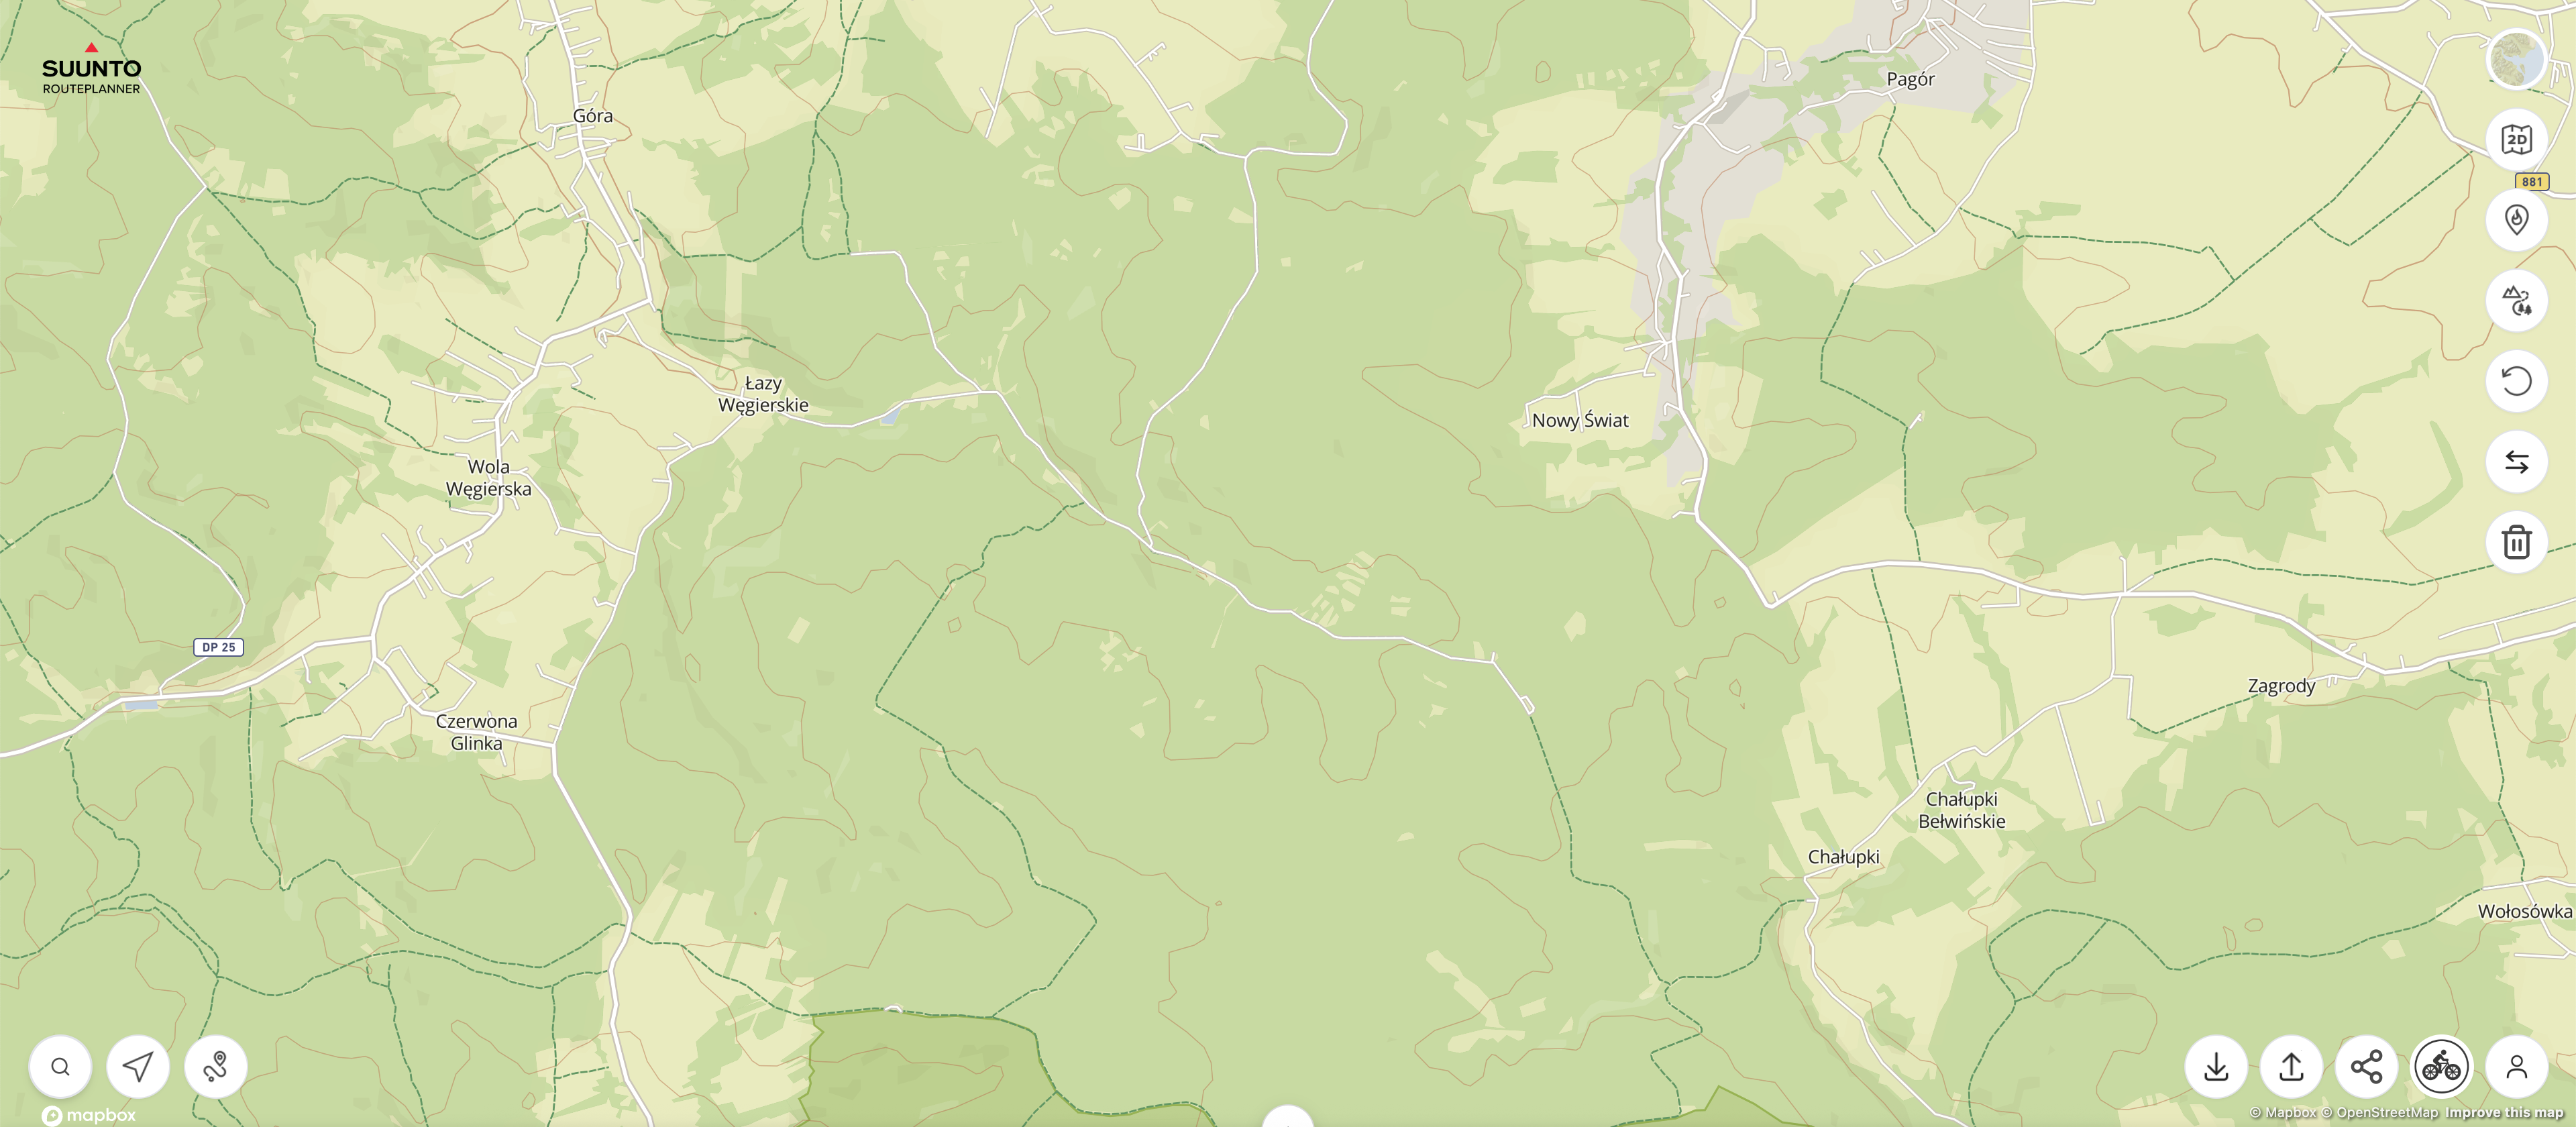
The problem with how trails and roads are displayed is simply disastrous - even in the route planner, compare the map at nearly the same scale and see how drastically it changes!
https://routeplanner.suunto.com/?lat=49.851338&lng=22.607213&zoom=13.1&style=outdoo
https://routeplanner.suunto.com/?lat=49.851338&lng=22.607213&zoom=12.95&style=outdoor
These aren’t watches, but maps on a computer - what’s the point of hiding so many roads?
-
Thank you for making this – it is much more convenient for me to make routes from my laptop than on my iPhone.
My question is regarding elevation data. It appears that the web route planner is using a very different algorithm or digital elevation model. It undercounts by about 50%! This makes it difficult to plan runs or rides in hilly or mountainous areas. Why is the calculation so different between each Suunto platform?
I made a route for a run today that was about 10.3mi (16.6km).
Suunto Route Planner (website):
Gain: 646ft (197m)
Loss: 656ft (200m)Suunto iOS app route builder:
Gain: 923ft (281m)
Loss: 895ft (273m)Suunto Vertical 2 watch (the recording of my run):
Gain: 1235ft (376m)
Loss: 1199ft (365m)For comparison, here is the elevation estimate from the Strava website route builder:
Gain: 1354ft (413m)
Loss: 1333ft (406m) -
@davemaps I’ve always found wildly different estimations that I don’t know who to trust. For example, I’ve got a trail run loop tomorrow. According to the different mapping tools I use:
- OnTheGoMap: Gain and loss: 7700 ft (2346 m)
- Plot-a-route: Gain and loss: 7011 ft (2137 m)
- Strava: Gain and loss: 6555 ft (1998 m)
- Suunto RoutePlanner: Gain and loss: 6214 ft (1894 m)
I’ve found that OnTheGoMap gets really close to what my Race S calculates, provided I’ve got stable weather. Crazy that so many different mapping tools can vary so much.
-
@davemaps I think the difference can be explained not by the absolute data accuracy but by the data resolution and thresholds used by algorithms.
The difference is the most noticeable when I plan a running route on a rolling terrain with a lot of small changes in elevation rather than one large climb and one large descent. I find that the elevation data produced by Suunto App and probably especially the route planner tends to be quite smoothed with a lot of smaller changes in elevation disappearing entirely. In some places I may be going up and down through a substantial dip, but the estimated elevation data would show that as a steady climb. Because of this smoothness, a part of estimated elevation gain is lost with every small climb or descent - the more small climbs and descents there are the more difference in estimated data vs the actual measurements. And not only the total elevation gain and loss numbers that are affected but also climb guidance data for individual climbs - all of them are usually short by anywhere from 10 to 30 feet (3-10 meters).




Hello! It looks like you're interested in this conversation, but you don't have an account yet.
Getting fed up of having to scroll through the same posts each visit? When you register for an account, you'll always come back to exactly where you were before, and choose to be notified of new replies (either via email, or push notification). You'll also be able to save bookmarks and upvote posts to show your appreciation to other community members.
With your input, this post could be even better 💗
Register Login