[Discussion] Share your projects
-
@Łukasz-Szmigiel The interface with the Suunto Vertical via USB is a multi-layered process where the SDSApplicationServer (a closed-source native binary) acts as a bridge. High-level clients, such as the VS Code extension, communicate with this server via WebSockets on port 9002 using a JSON-based REST API. The server then translates these JSON requests into an opaque, proprietary TLV binary protocol that is transmitted to the watch over USB HID.
Since the low-level protocol is undocumented, interfacing with the device requires a “blackbox” reverse-engineering approach. By mapping the open-source JavaScript logic from the VS Code extension and capturing the resulting USB traffic via Wireshark, one can correlate JSON inputs with binary outputs. While this is a complex task, leveraging AI significantly accelerates the process of identifying patterns in the hex dumps and automating the decoding of the protocol.
-
@Łukasz-Szmigiel I tested it on my race s and it worked although i had to make some adjustments to prevent crashing. But it definitely needs more testing and optimisation
-
@guderaber yeah I’ve learned it’s the hardest part as Suunto doesn’t document the actual hardware limits and it can’t be tested reliably in the simulator.
-
@AYamshanov this is super interesting! Happy hacking!

-
@AYamshanov are you getting into Ghidra yet?
-
@Ze-Stuart Great question! It actually reminds me of how my deep dive into the Suunto ecosystem began. For me, these watches aren’t just sports gear; they are a technological puzzle - kind of like Sudoku, but with more hex code.
")
After OpenSuuntoPlus launched, I was desperate for app examples to help me write my own. I decided to dig into the firmware, hoping to find the “real” apps hidden inside. I found several files, including a filesystem snapshot, but it wasn’t just a simple sequence of bytes. Instead, it was a massive pile of small blocks scrambled in a seemingly random order.
To better understand the algorithm, I decided to learn what Ghidra was all about (having never used it before). I naively thought watch firmware would be small, simple, and easy to analyze. I was… overconfident, to say the least!
However, it was incredibly productive. I spent time forming hypotheses, checking memory chip specs, and diving into SDKs for embedded OS memory management. I even managed to “de-fragment” a working disk image from those scattered blocks, though I’m pretty sure a few bugs are still lurking in there.
Around that time, I realized the role SDSApplicationServer plays in the system. I shifted my focus to the JSON-based REST API it uses. I figured if the VS Code extension could manipulate watch data through it, I could too. Ultimately, using the server was a much faster way to get data off the watch, and it largely confirmed what I’d spent days piecing together from raw blocks.
So, back to your question: Now that I have a better grasp of the architecture, I’ve been exploring how to communicate with the watch directly via the browser. Remembering my experience with Ghidra - and noting that the firmware is tiny compared to the SDSApplicationServer binary (which is dozens of megabytes!) - I haven’t quite summoned the courage to go back to this approach!
Analyzing serial interface dumps feels more manageable; control commands are usually just dozens of bytes. The more you work with them, moving from simple to complex, the clearer it gets. There are still plenty of mysteries left, but that’s exactly why I enjoy this “Sudoku” - it keeps things interesting!
-
@AYamshanov ah this is great: we share a mindset and a hobby! Making sense of compiled firmware is is challenging, to say the least, I’m not shy at sending Claude with a headless Ghidra session when I’m short on time.
-
First of - thanks to Suunto for opening up the possibility to enrich their marvelous watch lines with features that many users have been missing! It is always amazing to see where the combination of ingenuity and a (somewhat) open development platform takes us.
Being a road-runner with some sort of ambition to optimize races I have been missing a race pacer that allows for freely defining pace segments. The races I have participated in (Gothenburg area, Sweden) are quite often pretty hilly and I have found that I waste energy in the wrong places and therefore needed an app that could provide some guidance. The requirements were pretty close to “RaceWarden Pacer” - but I was missing the possibility to define the distance for the various segments of the race. And. With age comes poor eyesight, so I needed BIG (and clear) numbers to control the pace.
The logic/thinking:
You define your pacing strategy based on the elevation profile of the race and potentially other factors - this is all done outside of the app. Example from “Göteborgsvarvet” where I decided to try Jack Daniels’ Running Formula which roughly translates to -8s/km/%-gradient (uphill) and +5s/km/%-gradient (downhill). But that is outside the app, just the background to the pacing strategy.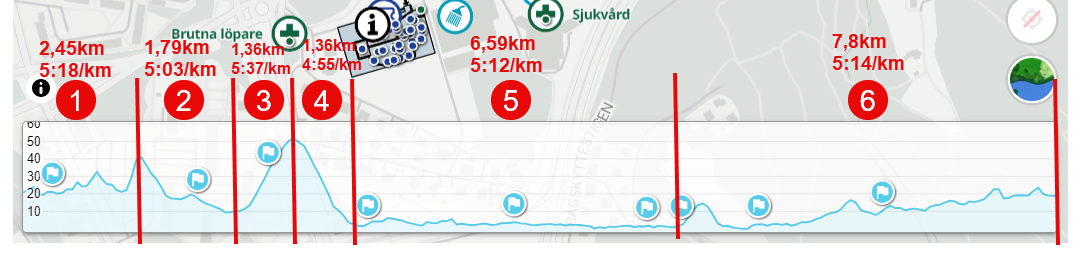
The pacing strategy is pushed to the app through user defined app settings:
Segment Distances (km or mile): 2.45 1.79 1.36 1.36 6.59 7.8
Segment paces (min/km or min/mile): 5:18 5:03 5:37 4:55 5:12 5:14(Is it possible to have two input fields in app settings?)
With the user input the total race length is calculated by summation of the Segment Distances (21,35km) - overall race target time (1:51:26) as well as target pace (general) is also calculated.
Then comes the tricky part. What is really needed / what can be displayed to help pacing (remember: poor eyesight)? I removed heart rate as I have found it does not work (for me) during races, and landed in the following configuration:
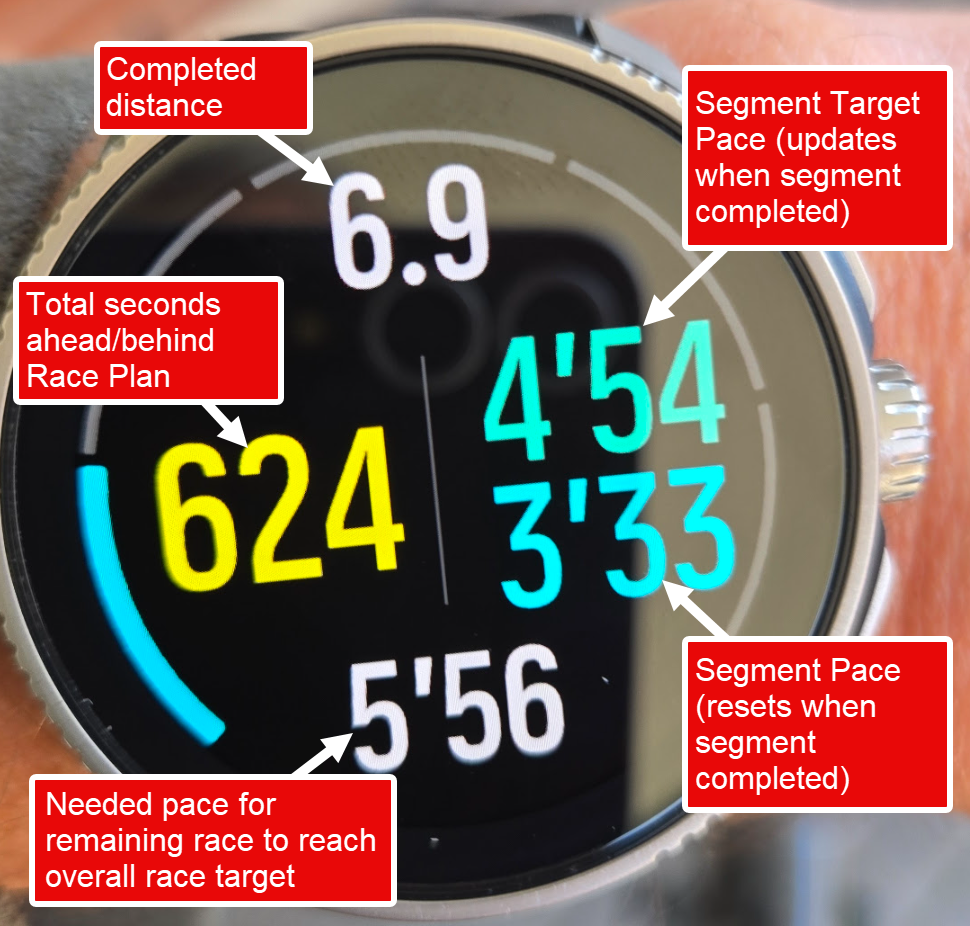
- Segment Target Pace: Derived from user input and displayed once a segment is recognized/completed. In essence this is a pretty static value, that only changes when a segment is completed.
- Segment Pace: Calculated. Similar to Lap Pace but utilizes the user defined Segment Distances/Segment paces, so it’s dynamic and updates as you run.
- Total Seconds ahead/behind Race Plan: Defined as the deviation between race plan and completed distance/time; naturally dynamic.
- Needed Pace: Based on initial user input finishing time and total race length are calculated. This is the pace needed for the remaining part of the race to reach the target
What would you see as missing?
The remaining challenges:
- I would like to have (I believe) at least some indication on heart rate - but I am not able to get the standard zone gauge to work and lack the skills to create one by myself with the canvas mysteries
- I tested to include an additional ahead/behind indicator focusing on ahead/behind per segment - but felt that it became more confusing and the display became to crowded - could this potentially be incorporated as a gauge?
- Compatibility - I believe maximizing fonts will be problematic for smaller watches but have not really had the energy to investigate what/how to make sure it works also for smaller displays
- Contrast - to me it seems yellow offers the best contrast, but is it just my eyes or a more common phenomenon?
All input welcome! (unfortunately it seems my application for the partner development has got lost in the mail, as I applied many weeks ago)
Also - I used the app (very successfully) during a recent race!
-
I wanted to share my work on an Aerobic Guide with short-term decoupling feedback.
Background
I have a long background in automotive embedded software development, though not as a software developer. Now that I am retired I enjoy coding for fun and personal use. I have no intention of becoming a Suunto partner or putting this on the app store, so if anyone wants to use any of these ideas in their own app, please feel free to do so.
The app
The app has three distinctive features.
The gauge
The gauge emphasises the current zone by enlarging its visual range and increasing the arc width. A quick glance tells you whether you are in the zone or not.
The HR chart
The chart is 350 pixels wide. Each pixel represents a 5-second average of HR, so you can see up to 29 minutes of history. Each time the chart fills up, 30 seconds of data scrolls off the left edge.
The Z2 zone boundaries are overlaid on the chart, making it easy to judge whether you are outside the zone because of a hill, whether you are in a stable situation outside Z2, or whether your HR is drifting up.
Compared to the built-in Suunto HR chart, this chart offers better resolution, does not require switching screens, and shows the zone boundaries.
That said, after evaluating good and bad runs from FIT files, it became clear that the HR chart alone is not a reliable indicator of fatigue and decoupling — hence the next element.
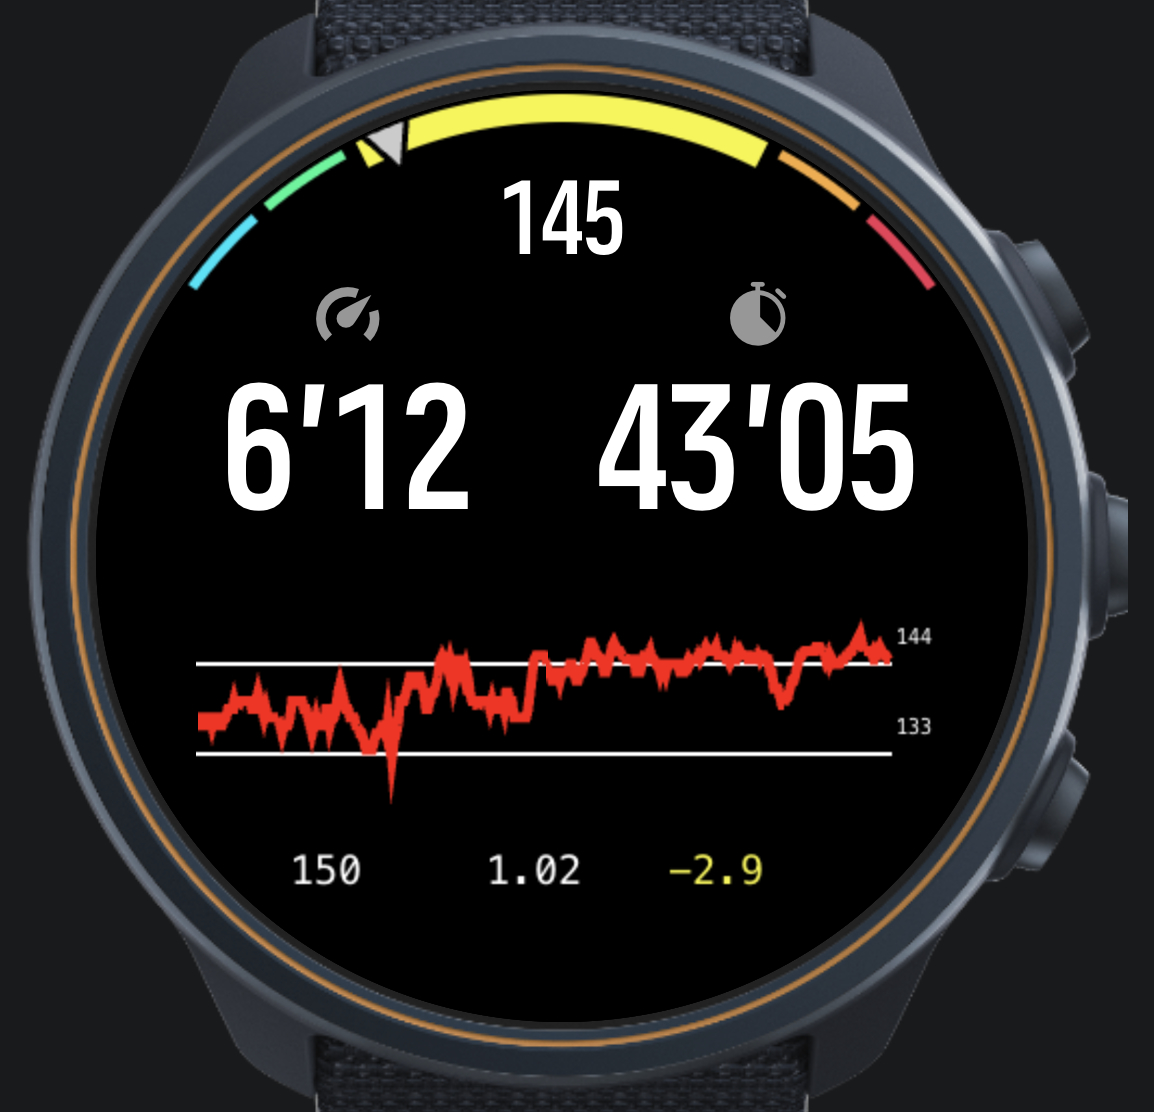
Dashboard
Below the chart, three values are shown from left to right:
- Current power (1-second)
- Current efficiency — power divided by HR (1-minute average)
- Short-term decoupling — slope of the efficiency curve (×1000)
This was inspired by the intervals.icu decoupling metric, but aims to provide a short-term, in-run indicator rather than a post-run summary.
The slope is computed by skipping the first five minutes, then performing a linear regression over the efficiency data. At most 20 minutes of data is used. The value cannot be directly translated to the percentage decoupling figure for a whole run, but the colour thresholds currently in use are:
Colour Threshold Meaning Green above −2 Stable / recovering Yellow −2 to −6 Drifting — consider slowing down Red below −6 Uncontrolled decline — stop or walk To arrive at these numbers, FIT files from real runs were replayed through a Python model. To keep this post manageable, I will cover that work in a separate post.
-
@matram neat idea! I wonder how heavy computationally and on the UI side it is. Let’s have a competition of who’s going to put the most into the S+ app without crashing the watch
-
M matram referenced this topic
-
@Łukasz-Szmigiel
For sure I would have liked to do more of this in main.js but with no method of passing an array we are stuck with doing this on the UI side. I try to stagger things on different points in time.My impression is that some of the limits that are in the Firmware are more due to older watch models. This was tested on a Race S, that may occasionally feel a tad sluggish. I have a new Race 2 and will test on that also.
But I am happy to accept your challenge

-
@matram I’m not sure about the old hardware. Perhaps it’s the architecture? There’s a reason why Run got totally new firmware (v3) that’s incompatible with the current (v2). It’s still a mystery to me why I can run Constantin on my old S9PP (the first device with UI2) with navigation and notifications along ZoneSense or other heavy apps, and it doesn’t crash, but it does on Vertical 2.
Hello! It looks like you're interested in this conversation, but you don't have an account yet.
Getting fed up of having to scroll through the same posts each visit? When you register for an account, you'll always come back to exactly where you were before, and choose to be notified of new replies (either via email, or push notification). You'll also be able to save bookmarks and upvote posts to show your appreciation to other community members.
With your input, this post could be even better 💗
Register Login