Ambit3 Peak cadence graph
-
Hi,
Wanted to share this a long time now but was always “forgetting” to do (procrastinator it’s called!).
Only my first run on my new Ambit3 Peak shows a “smooth” cadence graph (both MC and SA). Every other run since then shows a graph with big “jumps” between values.
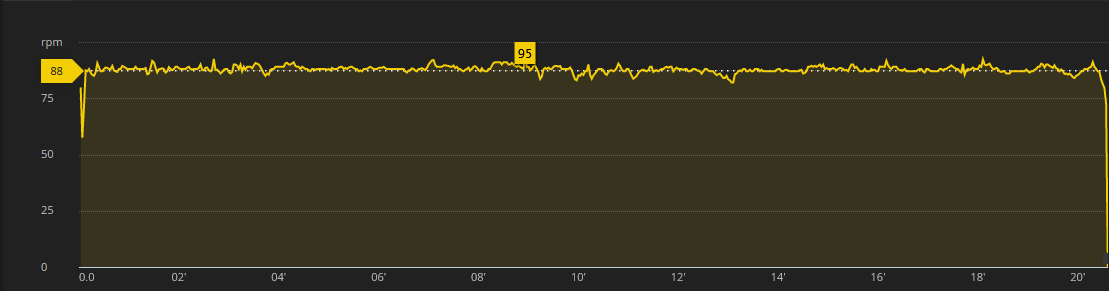
This is the cadence graph from my first run with Ambit3 Peak:
And this is another random one:
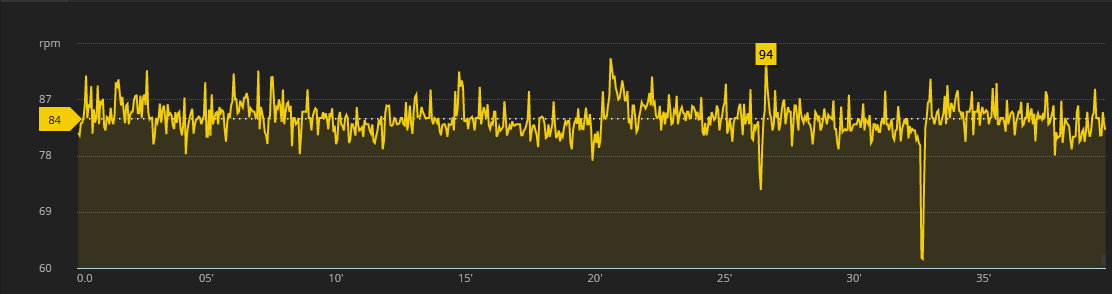
Both activities were synced via SA and then synced to MC, but the same applies on the graphs shown on SA (easier to include images from PC, but I can provide if needed).
Although on the first graph the scale for cadence is from 0 with +25 intervals whereas on the second example is from 60 with +9 intervals, if I “run” my cursor through distinct values, it seems that indeed on the first case there are no big jumps on cadence, whereas on every other run there are.
Is anything faulty on my watch? Do the cadence graphs for yours show “smooth” with small changes (both MC and SA)?
I’ve also tested to have the watch braced very very tight on my arm (blood was flowing though!) to see if the sensors is “fooled” if the watch is not very tightly braced but no help.
Thanks in advance.
-
@mlakis scaling issue. Look at the axis ranges.
-
So no problem at all
-
@Dimitrios-Kanellopoulos, I’ve also mentioned the axis scale. Here is another one I found plotted on the same scale (0 with 25 intervals):
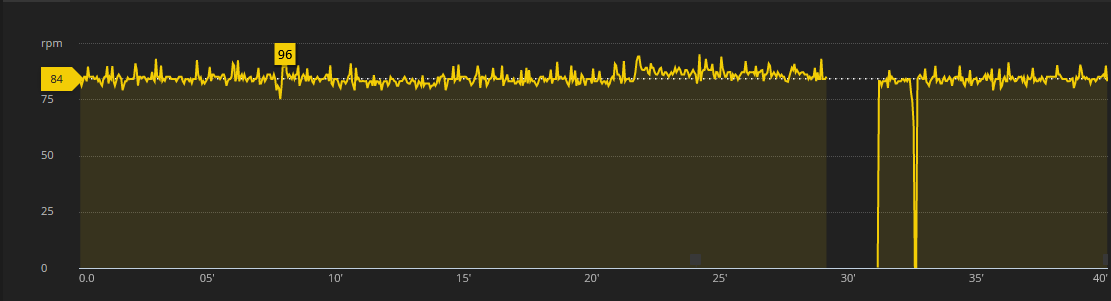
It’s not as smooth as the first one, the runs are both on tarmac, no big changes because of obstacles.
-
@mlakis still looks ok to be honest.
-
@Dimitrios-Kanellopoulos thanks
Hello! It looks like you're interested in this conversation, but you don't have an account yet.
Getting fed up of having to scroll through the same posts each visit? When you register for an account, you'll always come back to exactly where you were before, and choose to be notified of new replies (either via email, or push notification). You'll also be able to save bookmarks and upvote posts to show your appreciation to other community members.
With your input, this post could be even better 💗
Register Login