Strange (wrong?) TSS(s) evaluation
-
Hi all,
I hope this post doesn’t make any duplicate. I read a lot of other ones related to TSS calculation too, but no one seems to describe the same “pathology”.
A few weeks ago I ran the same track twice in the week, beeing proud the 2nd time because I ran significantly faster. But I noticed that the TSS of this fast run was lower than the one of the slow run :
               date     km   D+  duration  km/h    tss
2025-12-15 04:49:02  22.08  166  02:15:27   9.8  121.0
2025-12-23 04:59:50  22.04  157  02:03:45  10.7  115.5
Note: except from the speed, all data come from my Suunto Ambit 3 Peak, used without heart rate tracking. Thus I “tss” should mean tss[r] (aka rTSS).
According to me the 2nd run should give a higher TSS. I see that the measured distances and denivelation are both slightly lower for the 2nd run, but I don’t think this should counter the big difference (almost 10%) in the duration and thus the speed.
To complete deeper this analysis, I gathered all the fit files of the activities made on the same track and with the same watch. Then I plot the calculated TSS as a function of the duration, which gives me this figure :
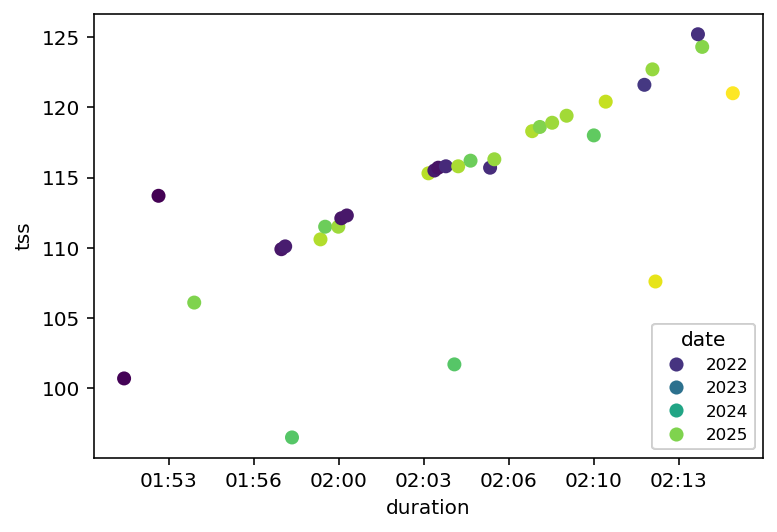
I don’t mind the few strange values which are out of the “main line” (they represent around 10% of the 32 selected points), but once again I don’t understand its shape.
The definition of TSS should produce a descending line (see my demonstration at the end of the message), not an ascending one.
So what does happen here ?
Bonus : I suspect that this behaviour can be generalized over other workouts even if the analysis is more difficult when comparing different tracks.
I found two other interesting recordings from my last summer holidays :date km D+ duration km/h tss 2025-07-13 06:30:25 22.6 1487.0 03:46:42 6.0 185.2 2025-07-15 08:28:33 12.0 806.0 04:57:16 2.4 201.0The first run is a competition ran fast though, not at my maximum.
The second one is a very gentle walk with my wife and my kids. Both recorded with the same watch using the same sport mode.
So do I need to stop running fast if I want to progress more ?
PS : my “proof” of why the plotted curve should decrease (let’s do some maths as we were still at school) :
Neglecting the constants used for normalisation, raw definition of TSS[r] can be expressed as formula (1) source: trainingpeaks
(1) TSS = duration . NGP . IF / FTPbut because IF = NGP/FTP we can simplify it as :
(2) TSS = duration . NGP² / FTP²Now let’s define ND as the “Normalized Distance” to match with NGP as NGP = ND / duration. Then we get :
(3) TSS = ND² / FTP² / durationBecause all the selected workouts are recorded on the very same track, ND is a constant through the plotted data.
And I assume that FTP doesn’t change over the time because I use neither pace nor heart levels (I can’t remember when I modify them for the last time, considering that I really did it once). And according to me this is confirmed by the chosen colorscale on the plotted data.
So for this example we end with :(4) TSS = Const / durationwhich tells us that : lower the duration, higher the TSS.
All but suprising ! -
@FredJ said in Strange (wrong?) TSS(s) evaluation:
The definition of TSS should produce a descending line (see my demonstration at the end of the message), not an ascending one.
Whose definition of TSS? The more time you spend at intensity, the more training stress you accumulate.
So if time increases from left to right on horizontal axis, further right the higher the TSS scores on your graph. -
@FredJ TSS quantifies the training load based on intensity zones (HR, pace, power,…) and duration, so the higher the durarion the higher the TSS or, at the same duration, the higher the intensity the higher the TSS.
-
@FredJ the problem with Suunto hrTSS is that it evaluates time in zones not the actual HR rate. And unfortunately in Suunto zone 1 begins at zero. Even making your resting heart rate higher won’t change this.
I made a test recording my HR just sitting at the table and got similar result as when I jogged lightly in zone 1 for the same amount of time.
Solution would be to have lower limit on zone 1 like Garmin has.
Until then, I use rTSS (pace) for my walks, which is roughly 33% of hrTSS, and 66% hrTSS for my hikes, provided the terrain is hilly. The more flat is the terrain, the more I lean towards the walking percentage -
@Squirrel said in Strange (wrong?) TSS(s) evaluation:
Whose definition of TSS? The more time you spend at intensity, the more training stress you accumulate.
So if time increases from left to right on horizontal axis, further right the higher the TSS scores on your graph.@jjpaz said in Strange (wrong?) TSS(s) evaluation:
TSS quantifies the training load based on intensity zones (HR, pace, power,…) and duration, so the higher the duration the higher the TSS or, at the same duration, the higher the intensity the higher the TSS.
I agree with you but your answers don’t match my case because all the workouts on the graph use the exact same track.
So when I increase the duration I simultaneously decrease my speed, thus my intensity, thus my stress.I felt absolutely no tiredness after my slowest runs (2h15) but ended exhausted with muscles pain the few times I ran really fast (< 1h55).
So if it is considered normal that the first ones generate more stress than the seconds, then I guess this stress score is definitely useless -
Not sure I fully understand the problem, but rTSS depends on pace zones( same as in TrainingPeaks), if zones were changed between those runs you will get different TSS calculation.
-
@FredJ I see your point. And this is related to the fact that TSS is based primarily in duration and aerobic/cardio stress nor in muscular stress.
Hello! It looks like you're interested in this conversation, but you don't have an account yet.
Getting fed up of having to scroll through the same posts each visit? When you register for an account, you'll always come back to exactly where you were before, and choose to be notified of new replies (either via email, or push notification). You'll also be able to save bookmarks and upvote posts to show your appreciation to other community members.
With your input, this post could be even better 💗
Register Login