Training readiness would be great for an upcoming update !
-
I’m recently new to Suunto with the Race S model, and I did consider others, including Garmin before I made a decision. The main watch I was looking at was the Forerunner 265, which does have a training readiness feature; however, other models I looked at like the Forerunner 165, Venu 3, and Vivoactive 6 do not have this feature.
If the hypothesis is that this metric is more important for people new to fitness, then Garmin is doing a poor job in not having it available on more entry level models. If we assume that folks getting the 265 and more advanced models like the Fenix series are more informed enthusiasts, then they don’t necessarily need this kind of summary if they are going to drill into the detail anyway.
Garmin’s page on the feature is here: https://www.garmin.com/en-US/garmin-technology/running-science/physiological-measurements/training-readiness/
It is a 1-100 point system that breaks into five categories: poor, low, moderate, high, and prime. At a glance, it could be simpler. Looking at the watch screen’s “summary text” they have moderate as “good to go” while high is “ready for challenges” and it’s unclear what level of activity for me would separate those two.
Worse, the page’s description describes situations where their feature is simply wrong. For example:
“If you are using a block-based training model, then a lower training readiness score during a deliberate overload period likely echoes that work. Against that background, you should still check to see which factors are driving that lower score. Higher than normal acute training loads and longer recovery time estimates can be expected during block training. Reduced readiness caused by other factors (e.g., sleep history or high stress) might be reason to re-evaluate your approach.”
So basically if one has a low training readiness score, go and look at all the metrics that feed into the score and make your own evaluation. Wait, there’s more:
“Does a less than prime readiness score mean it is time to scuttle your pacing strategy and lower your expectations? There will be times when you may notice a link between training readiness and performance, but strictly speaking the training readiness analysis is not designed to predict performance. Many athletes report sleeping poorly the night before a big event and go on to achieve impressive results and set personal bests.”
Garmin does not mention the possible psychological effects of seeing a low training readiness score on a race day, for those who have not bothered to review this page. Being told “you probably can’t do well” isn’t going to be great motivation, although perhaps others will be more “I won’t let this watch tell me what to do.” Does this make for a good feature?
To be clear, I’m not fully opposed to some kind of summary information, but not at the expense of not knowing the details that derive the score. If Garmin were to “break out” the score – showing a “88 / High” score as the result of adding X from sleep, Y from predicted recovery time, Z from HRV, Q from acute training load, etc. then can better determine if they need to make a modifier.
If Garmin thinks my recovery time for an event is two days or 50 hours, and I know from history I typically am fine with one day for that level of effort, then I could “bump up” to the next range. However, as Garmin does not show their homework, the only thing I can do is do my own work myself, negating most of the feature’s usefulness.
-
TrainerRoad has a good approach where they have red, green and amber days.
Red days - recommended rest or very easy. Amber - don’t push too hard (I wouldn’t do intensity on one of these days). Green - good to go.
A simple system like that would work well enough.
-
@raven said in Training readiness would be great for an upcoming update !:
Today I decided to do an hour of indoor cycling at a moderate effort. I wanted to do more ZoneSense testing so was staying at the middle to upper end of the green Aerobic zone and was a comfortable ride. After that, I continued with some upper body dumbbell weights (bicep curls, shoulder raises, rows) then a short yoga session with standing balance poses that doubled as a cooldown phase. I’m not sure how a single number or emoji score would have informed me to do that combination of activities.
It wouldn’t. That’s not the point, it’s not an AI coach. The idea is to show you whether, based on the data at Suunto’s disposal, you are good to go full gas or should hold back or rest.
It’s a guide, like much of the other data provided with similar caveats (sleep cycles, resources etc).
-
@2b2bff said in Training readiness would be great for an upcoming update !:
I think Suunto reinforces that get a feeling for your body kind approach. Even more so with ZoneSense…
I think ZoneSense is great but it tells you nothing until you are 10 minutes in to a run. Completely different use cases.
-
@raven said in Training readiness would be great for an upcoming update !:
To be clear, I’m not fully opposed to some kind of summary information, but not at the expense of not knowing the details that derive the score. If Garmin were to “break out” the score – showing a “88 / High” score as the result of adding X from sleep, Y from predicted recovery time, Z from HRV, Q from acute training load, etc. then can better determine if they need to make a modifier
This is a great idea. That way for example if it is due to your sleep being rated only 70, but you woke up feeling fresh as a daisy, you can ignore that. However if your sleep is rated 50 and your HRV is in the red, you can probably trust it telling you to take a rest day.
-
@James-Eastwood said in Training readiness would be great for an upcoming update !:
It wouldn’t. That’s not the point, it’s not an AI coach. The idea is to show you whether, based on the data at Suunto’s disposal, you are good to go full gas or should hold back or rest.
It’s a guide, like much of the other data provided with similar caveats (sleep cycles, resources etc).
If your only two options are “go race effort” or “need to rest” then that removes a wide range of possibility in the middle. Are you actually only asking for a thumbs up / thumbs down on training feature? Also, in my quotes from Garmin above, they gave two examples where their Training Readiness might tell you things are bad, and yet you can probably go full gas anyway.
-
@d-v Excellent suggestion
 If the watch and app can measure your Traing Load (TL) for a period of 2 to 4 weeks, along with sleep, and HRV a better level of readiness can be engaged for an upcoming training event.
 -
Looking again at Garmin’s page, let’s see what we can do to invent our own feature, for those who want a number. Again, the page I’m using is this:
On that page these’s six criteria listed, but two of them are both related to sleep, one factor is last night, the other history. One factor, Recovery Time, currently does not have a quick way to check with Suunto – one can look at individual sessions, but not have an aggregate total. Here’s the list, in my own ordering:
Sleep (Last Night)
Sleep (History)
Stress History (Resources)
HRV Status
Acute Load
Recovery TimeI’m also going to add on Overnight Heart Rate (average/min) as a category. Now let’s give all these factors a “weight,” that is, how much they can contribute to a total score of 100. Note all the following is just me making stuff up; please, no wagering.
Sleep (Last night) 30%
Sleep (History) 20%
Resources 20%
Overnight HRV 20%
Overnight Heart Rate 10%This gives a total of 100% – I decide for the Acute Load and Recovery Time, i would make those “only negative,” that is, if your Recovery Time is zero, that doesn’t help this status, but having a recovery debt detracts from the rest. So add the first five, get a total, then decide if you need to subtract to lower the score.
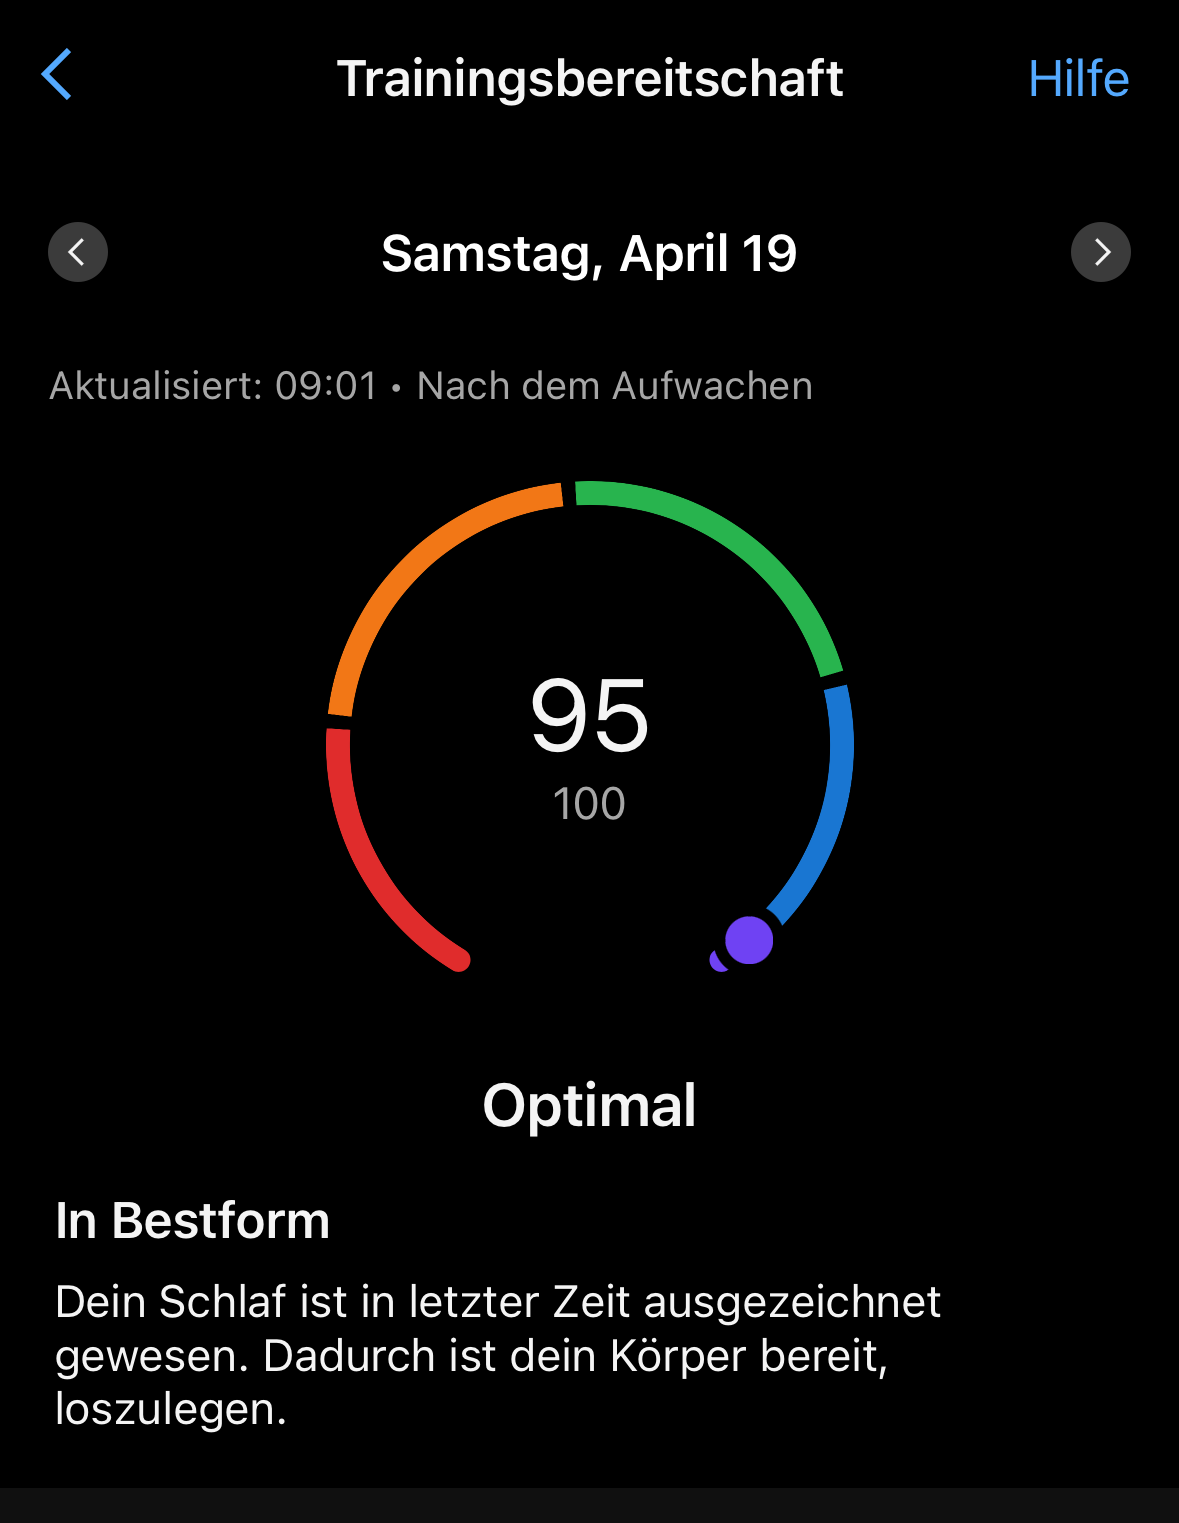
So in my picture from before, I’d score self like this:
Sleep Last Night 20 of 30 (a little low)
Sleep History 20 of 20 (last week fine)
Resources 15 of 20 (73%)
Overnight HRV 20 of 20 (right in range)
Overnight Heart Rate 8 of 10 (could be lower)This adds up to a score of 83, currently in the High range. Looking for negatives in recovery and ATL, neither was a factor.
And 83 fits roughly in how I felt. I could handle most of my normal activities. Note this isn’t too far off my Resources score of 73 though, so maybe just use that.
Now this still does not take into account muscle fatigue, mental state, outdoor weather, or other things that might influence what I do.
-
@James-Eastwood please read that line again. I didn’t say ZoneSense is the same with any word…
")
-
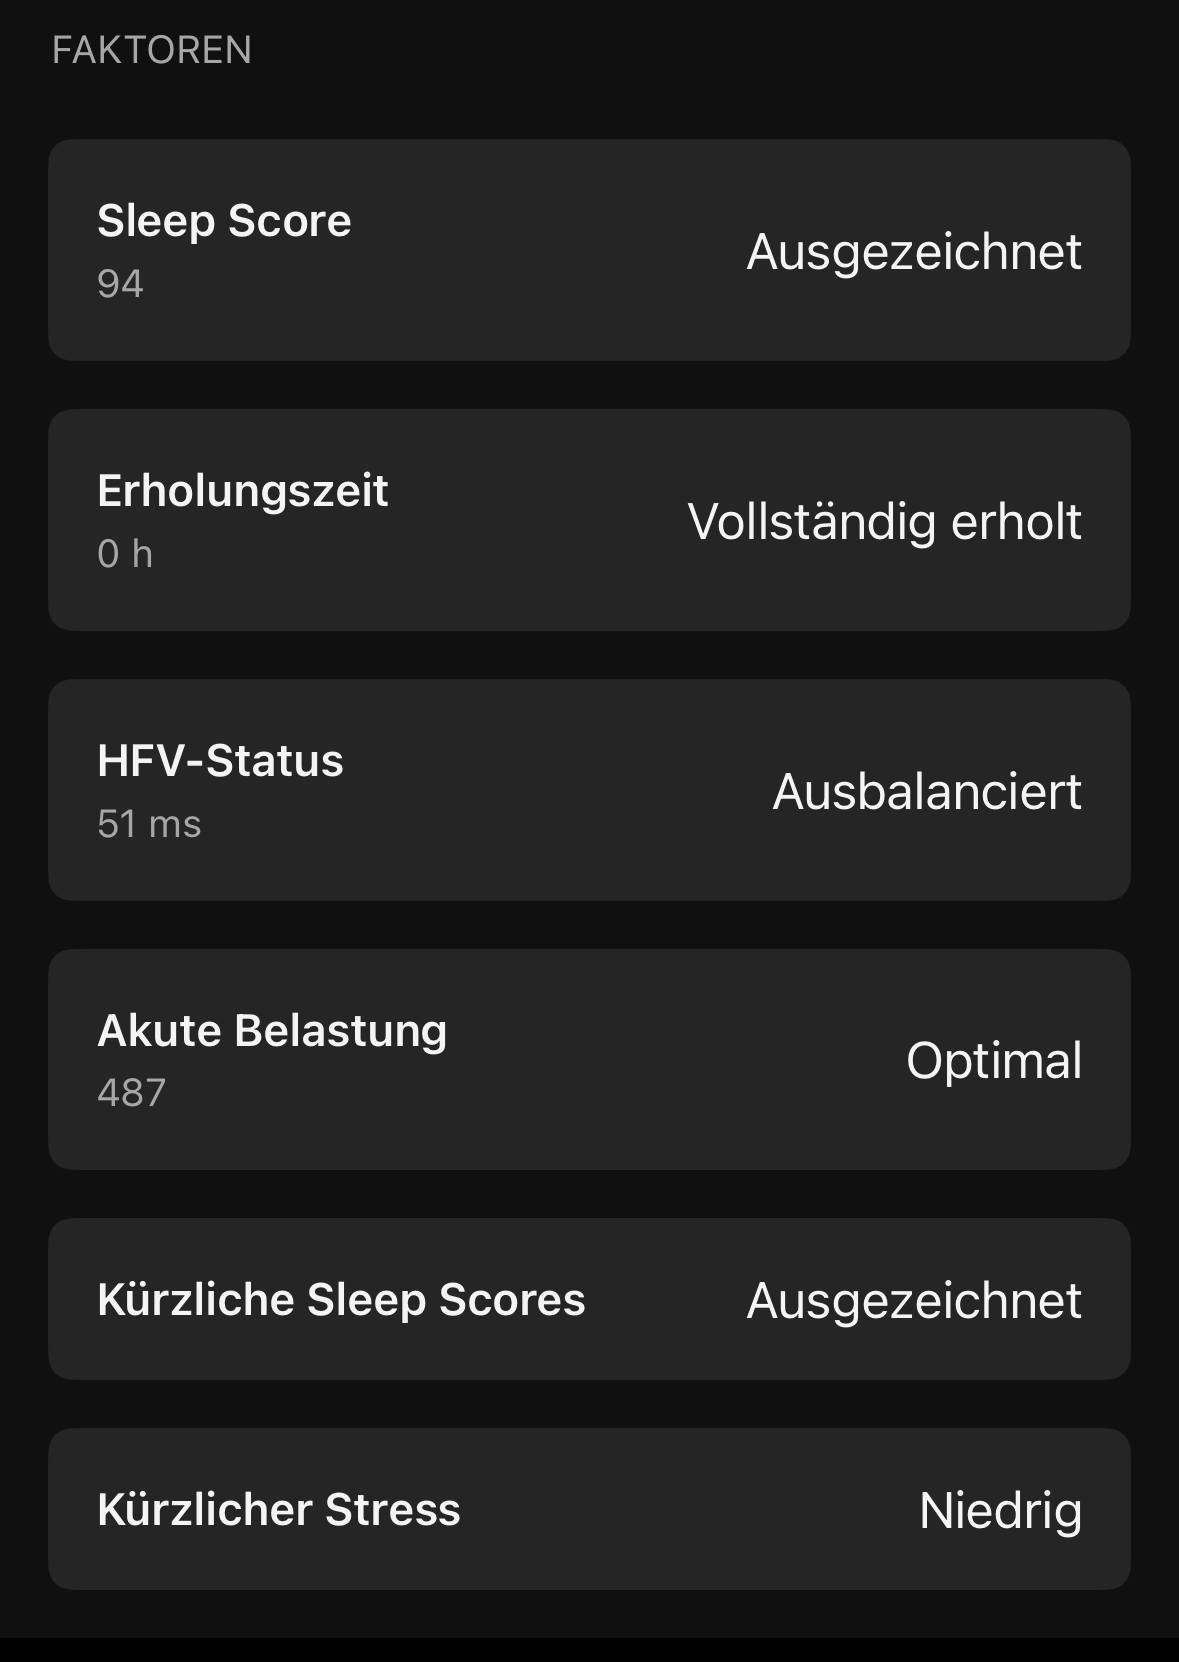
@raven said in Training readiness would be great for an upcoming update !:
If Garmin were to “break out” the score – showing a “88 / High” score as the result of adding X from sleep, Y from predicted recovery time, Z from HRV, Q from acute training load, etc. then can better determine if they need to make a modifier.
Actually they do so:
-
As a first pass that seems pretty reasonable to me!
-
@2b2bff Ah, interesting! I was just looking at the watch pictures on their page.
-
Maybe

-
@raven you als have this on the watch in the training readiness widget…
-
@2b2bff said in Training readiness would be great for an upcoming update !:
@raven you also have this on the watch in the training readiness widget…
Again, good to know. My info just came from the Garmin page I linked above, more specifically, this photo:
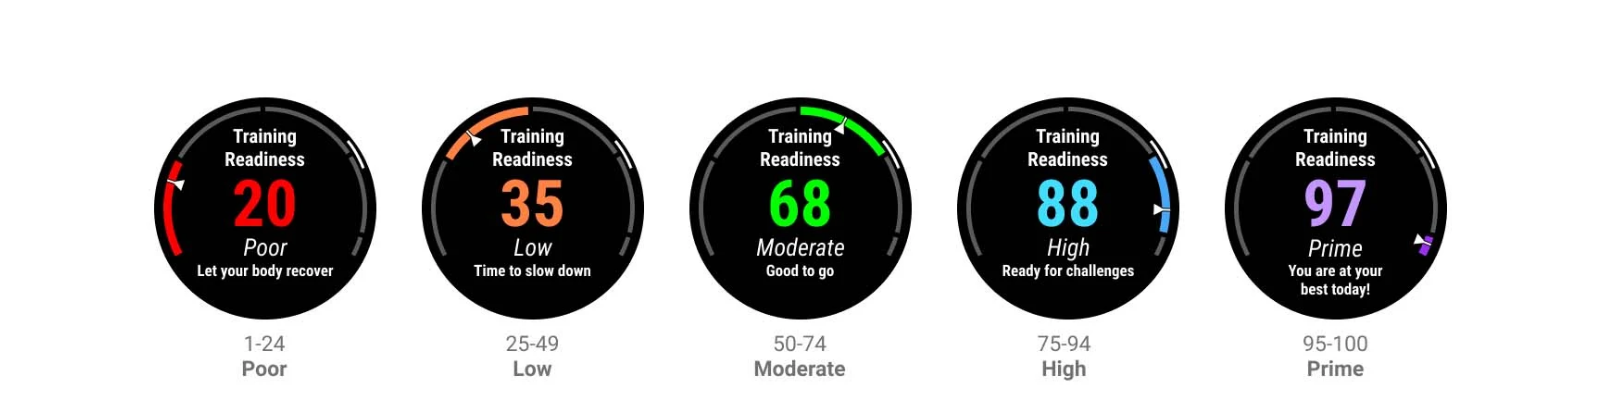
As I noted, I particular find it difficult to understand the difference between the Green and Blue distinctions here. I’d need to see more specific examples of one day in the green and one day in the blue, with the contribution breakdowns, and then perhaps I’d be more on board. As someone who recently was debating between Suunto, Garmin, Coros, and Polar, I find it odd this feature is not on the lower end models where I think it would be more appreciated, other than to try to encourage people new to fitness to spend a little bit more to get it.
Anyway, this is just to summarize at the moment I’m not a fan of a 1-100 score with five colored stages, and perhaps a three stage system of basically Stop, Warning, Go seems better, which Suunto does have on the HRV feature.
https://us.suunto.com/blogs/blog/how-to-use-hrv-to-optimize-your-recovery
For those who want something like the Garmin, they could cobble together a system like I quickly did above. The harder part is an initial investment on how one wants to weigh things, but after that, day to say I think it would be quick to look at the widgets on the home page and assign some numerical score to it as one wishes.
Sounds like Suunto is doing something in thie area so will be curious to see what they come up with.
-
The hrv example is a good one, as it shows Suunto is already on board with this approach. The suggestion is basically just to show the same thing, but taking more of the available data in to account.
I wouldn’t mind if there wasn’t a number at all, and it was just an arrow pointing at a colour on the spectrum. Numbers are useful for longer term pattern analysis though, like for example in intervals.icu.
-
@James-Eastwood For me the difference is the HRV number is a measurement with a known way of determination. With the Garmin number, while the factors are listed, as far as I know the math to get the final number is not really shown. Additionally, I think I find some friction when also considering Suunto’s Resources metric (Garmin’s Body Battery) that’s also a 100 point scale in both cases. Can there be times one has low body battery / resources but high readiness, or vice versa, and if/when that happens, what does that mean?
-
In latest iOS beta there is Recovery state chart under Recovery tab. It is impacted by training load, sleep data including HRV and daily activity such as stress tracking. Recovery state is a measure how well body is recovered and ready for sport activities. Looks great. I guess it could also be used as base for training adaptive plans in the future.

App: beta
Phone: Iphone
iOS -
@dulko79 should also come to Android in next release
-
The new Recovery feature is in the App Store for iOS — beta not required. Here’s how it looks:
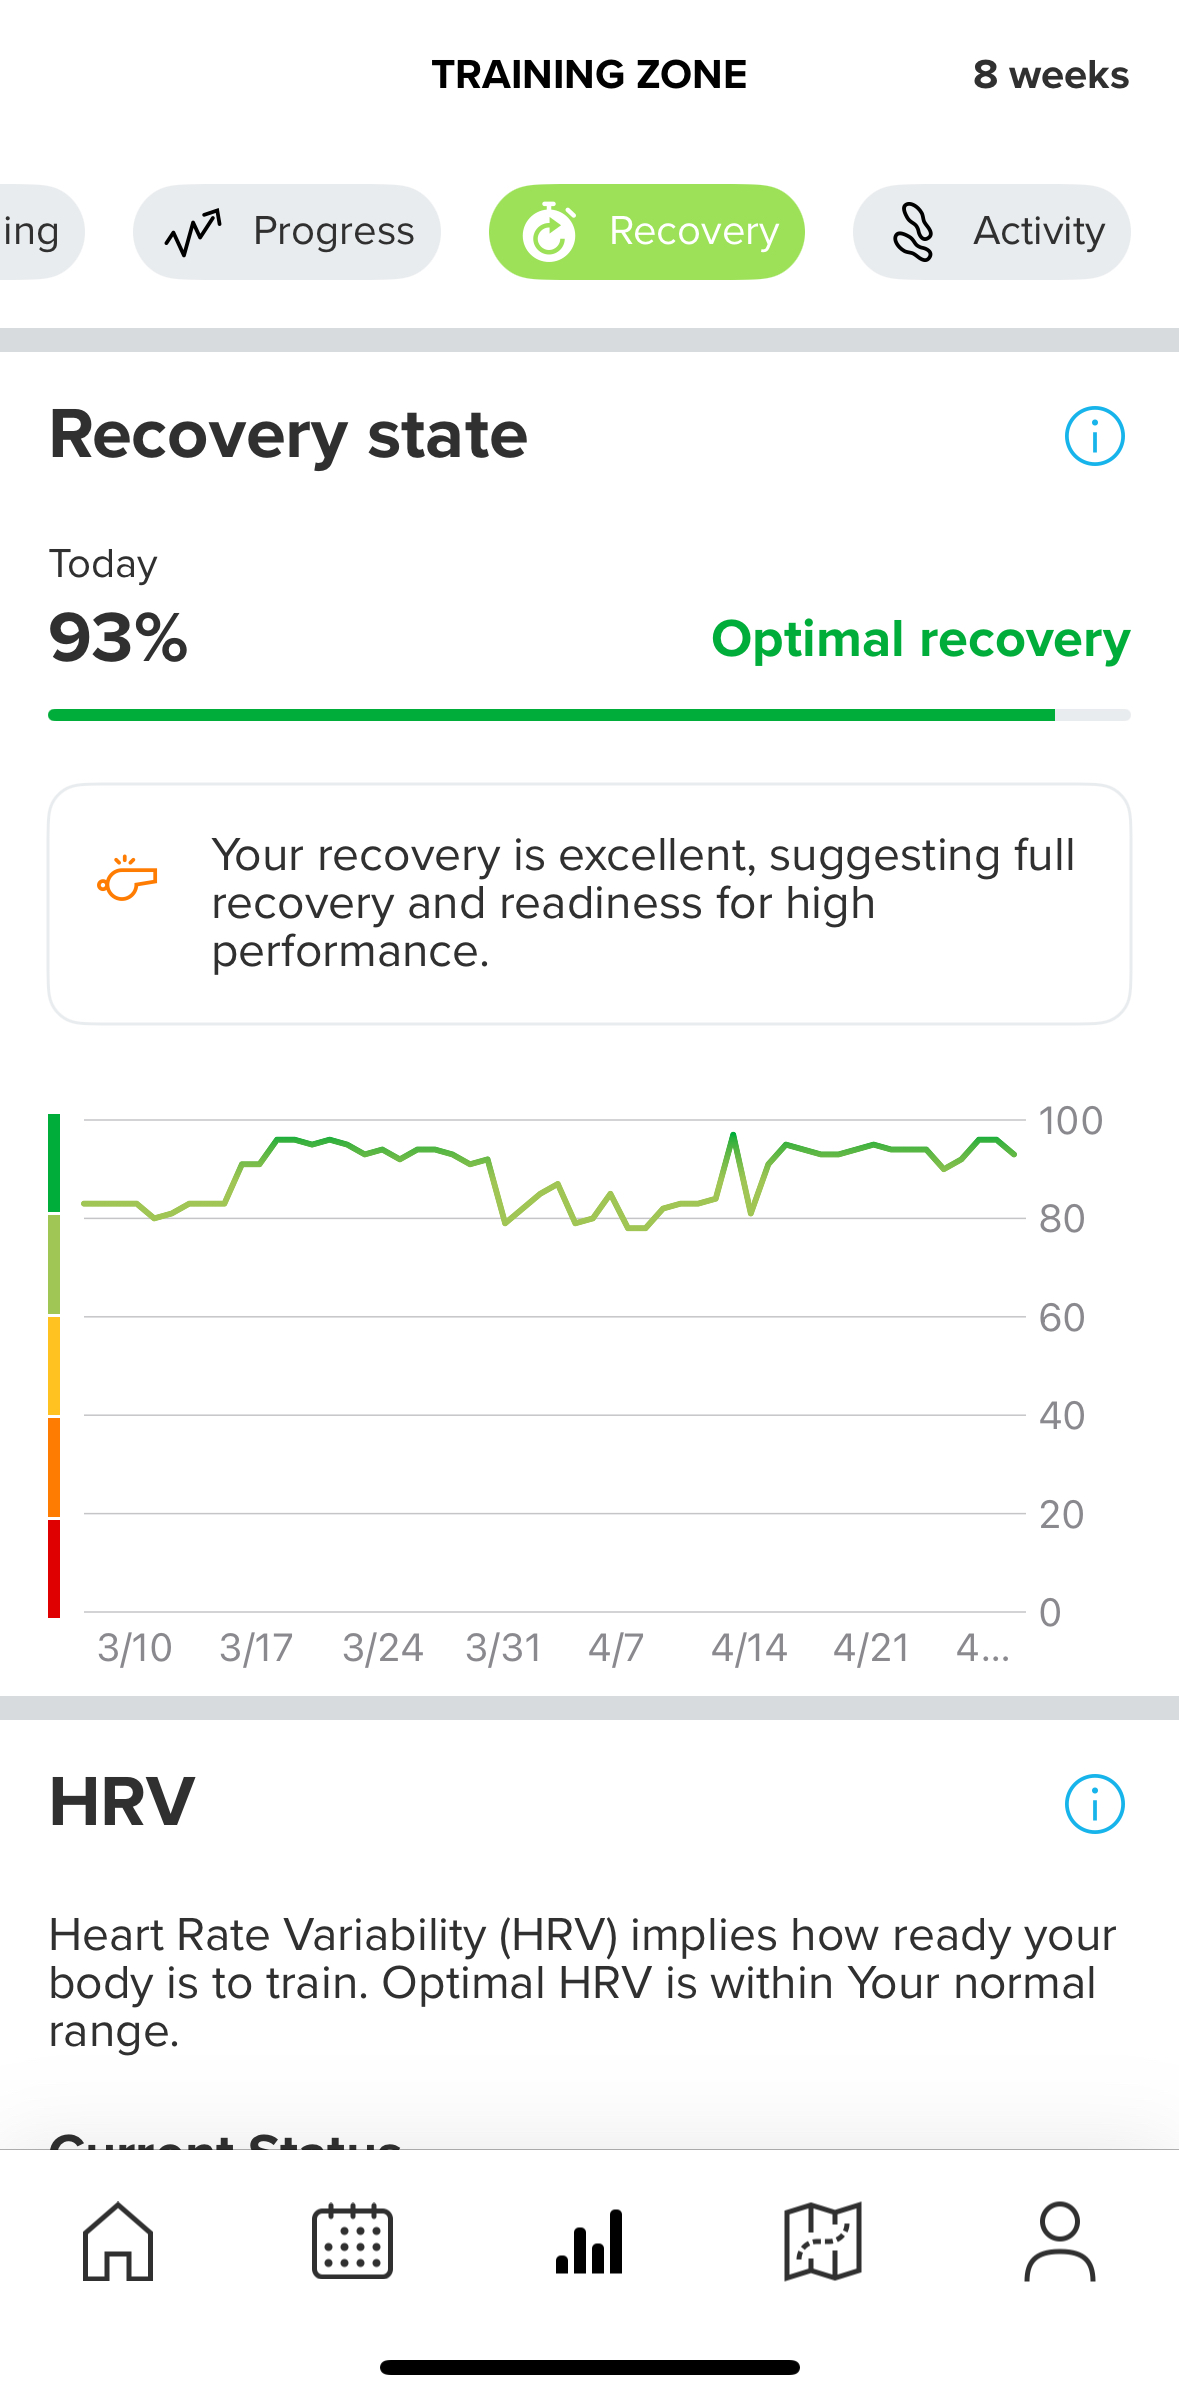
Note at the time I took this screenshot, at the same time my Resources read as 34% (I had run 11km earlier in the day), but also says I had 78% wake up resources.
I interpret this as Recovery is telling my “best state” as I first wake up, and does not update throughout the day. This is fine but not completely clear in the info shown. If I wanted to do an additional workout now, I would not trust the “93%” showing on Recovery. Instead, I’d look to either the 34% Resources or my 86 CTL / 95 ATL / -2 Form, which means right now tomorrow will be at -9 Form. I could do a little bit more but not another 10km run, despite 93% Recovery still showing.
Clicking the info on the top right of the Recovery area gives this information
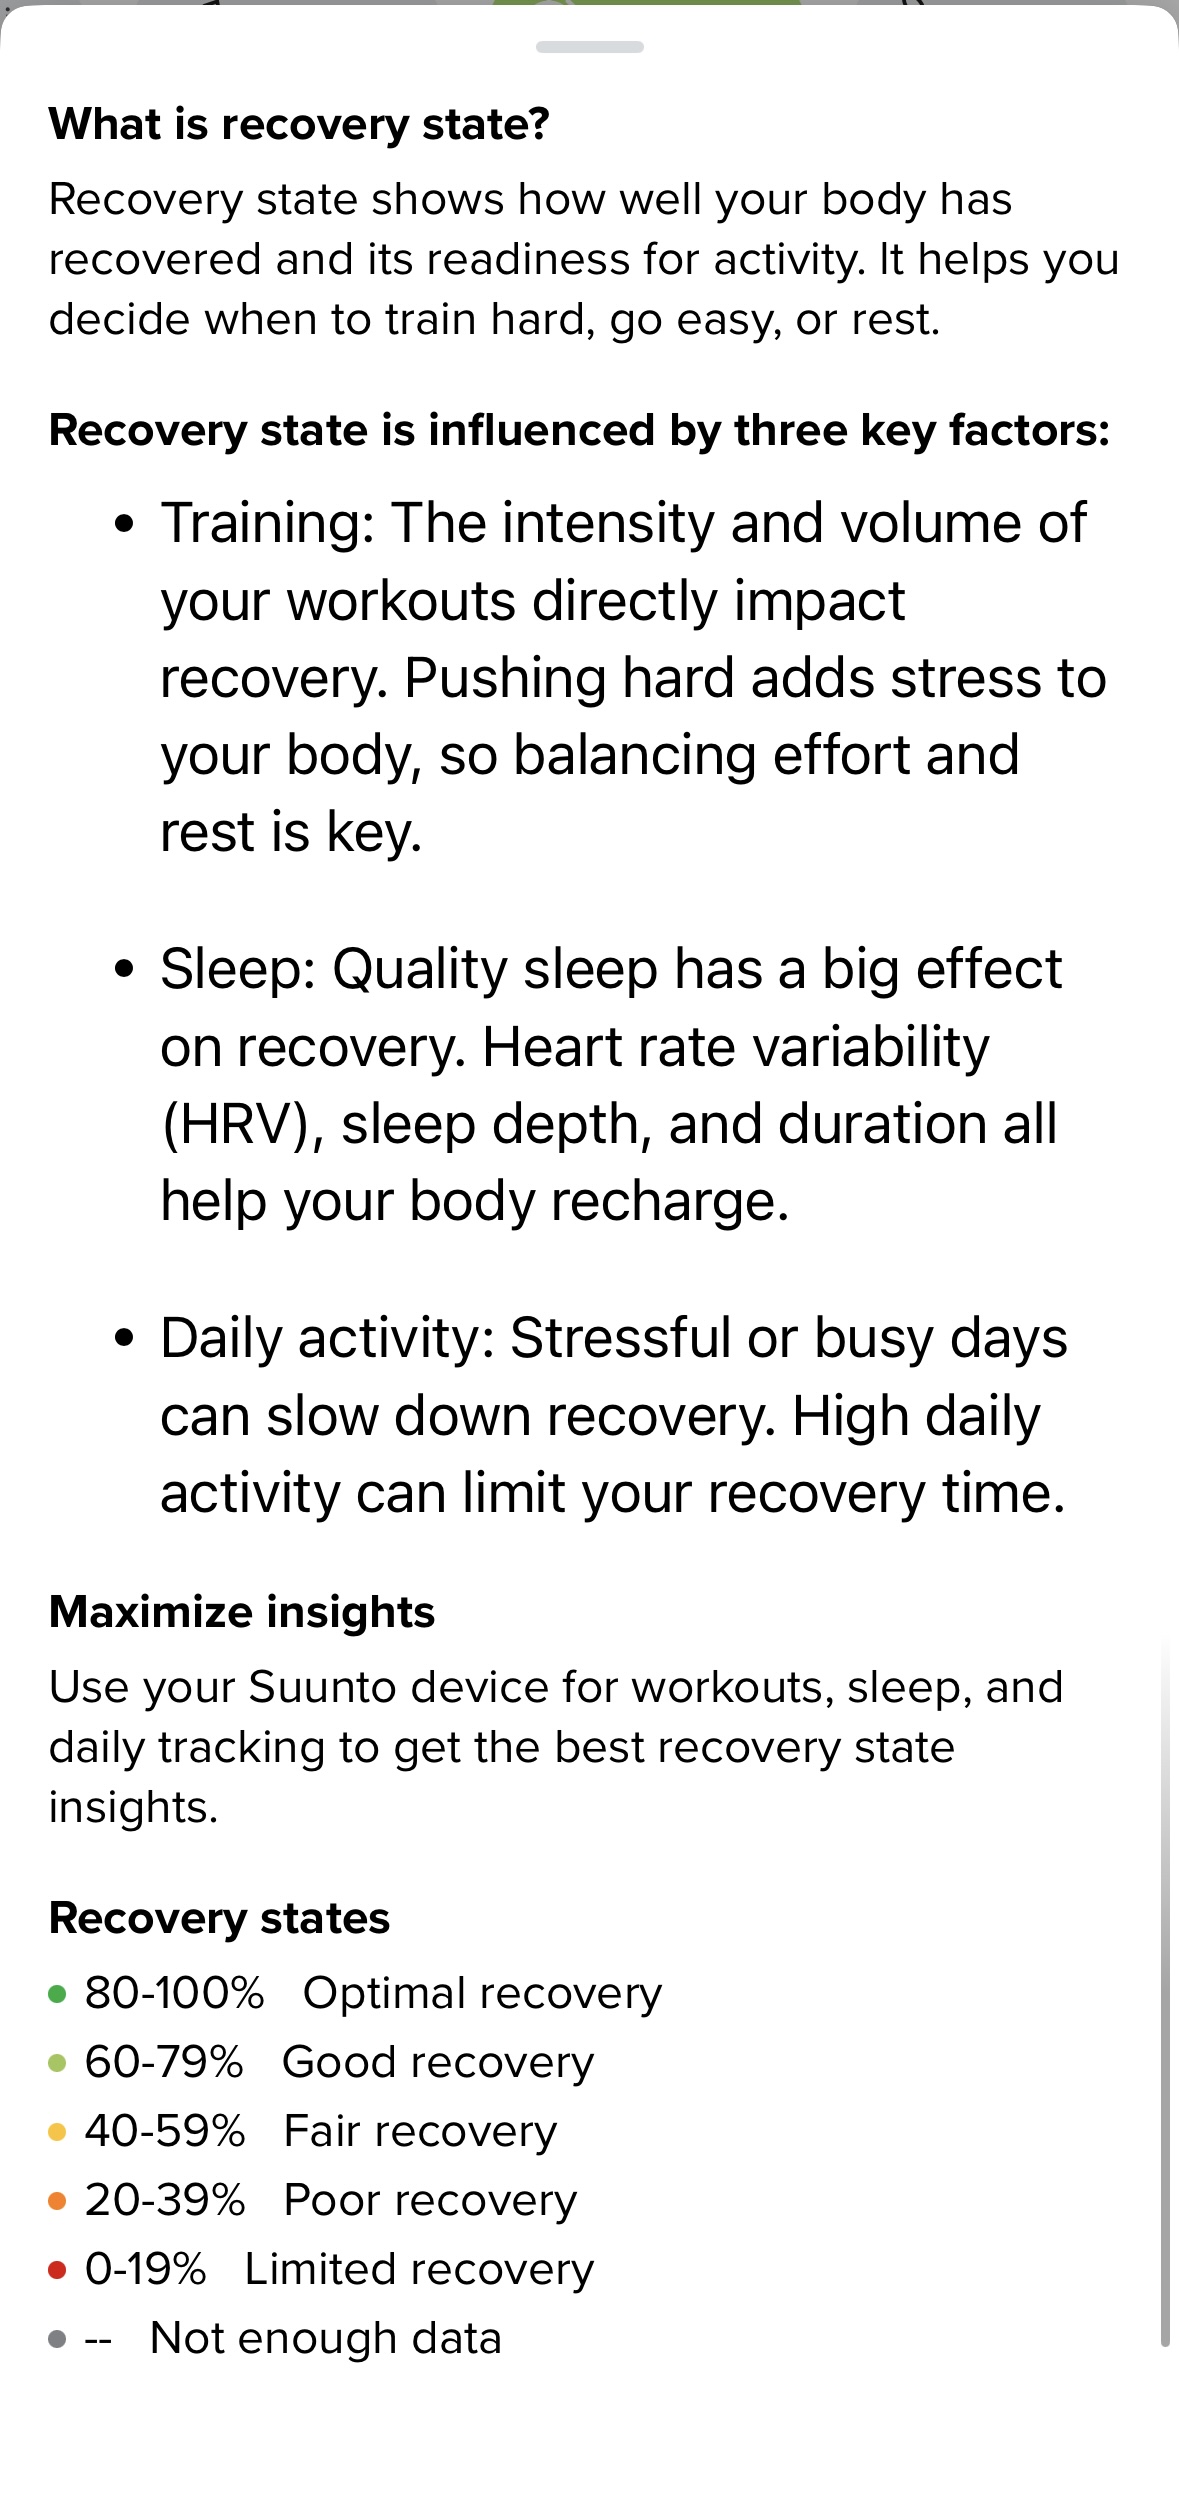
I’m not sure what’s up with the different fonts used there. A bit weird.
There’s no way to “open” the graph and get discrete information on other days, that I can see, which is a limitation I also have in other areas, like the daily heart rate graph. Additionally, there’s no “widget shortcut” to put on the home page, although one can select the HRV widget to quickly get to that area.
As an aside, I find the Training Zone tab overloaded, with Overview / Summary / Training / Progess / Recovery / Activity areas all bundled together. I think this is due to having five tabs on the bottom: Home, Calendar, Training Zone, Maps, and Settings/Profile.
I’d remove the Profile tab, and instead on the Home page put an icon on top to get Settings/Profile (where on the left is the Watch icon, and on the right is a + with some menu items and notifications. Put a Gear symbol up there on the right, and now you’re down to four tabs, and can split Training Zone up a little bit.
When I select the heart rate widget on the Home page, I get a “Today” screen, that starts with a summary of distance / time / calories, then an activity log for the day, sleep data, resources, heart rate graph and stops and calorie graphs. This Today screen isn’t in the Calendar tab though, and the Activity bubble in Training Zone also gives steps/calories but in a scrolling view showing multiple days. If one wants to go from “daily view” of calories/steps to the scrolling view, it’s two different areas.
There’s a lot of good info in Suunto app, and it’s not horribly organized but there are areas of improvement that could be done.