Zonesense difficult to understand
-
@alebalbis Spot on assessment of how Zonesense can be used.
*also you are right, I was exhausted as I recovered from that one
-
@VoiGAS said in Zonesense difficult to understand:
@Antoine Looks like Zonesense just takes the HR when entering a zone. In your case the two peaks were when your heartrate was rather low (so not really in sync).
If that really is the way it works, then its rather useless because it will be wrong due to lag or other effects.
For me Zonesense looks more like a Proove of Concept than an actual working feature…That is not how ZoneSense works. Have you watched the video? Have you read the peer-reviewed manuscripts published in scientific journals? Have you read the white paper? Please stop speculating on what you think is happening. Perhaps educate yourself instead of making statements that are completely incorrect. I have replied to you many times stating this is not a measure of HR, so have others. It is not meant to follow HR nor is the measurement based on HR. It is based on relationships between IBI and in this manuscript, has been tested far more scientifically than anyone on this forum including me is likely to do. You refuse to acknowledge this. I am fine with you being skeptical of using it but understand how the feature works prior to continuing to assume it is synced to HR!
Kanniainen et al. - 2023 - Estimation of physiological exercise thresholds based on dynamical correlation properties of heart r.pdf -
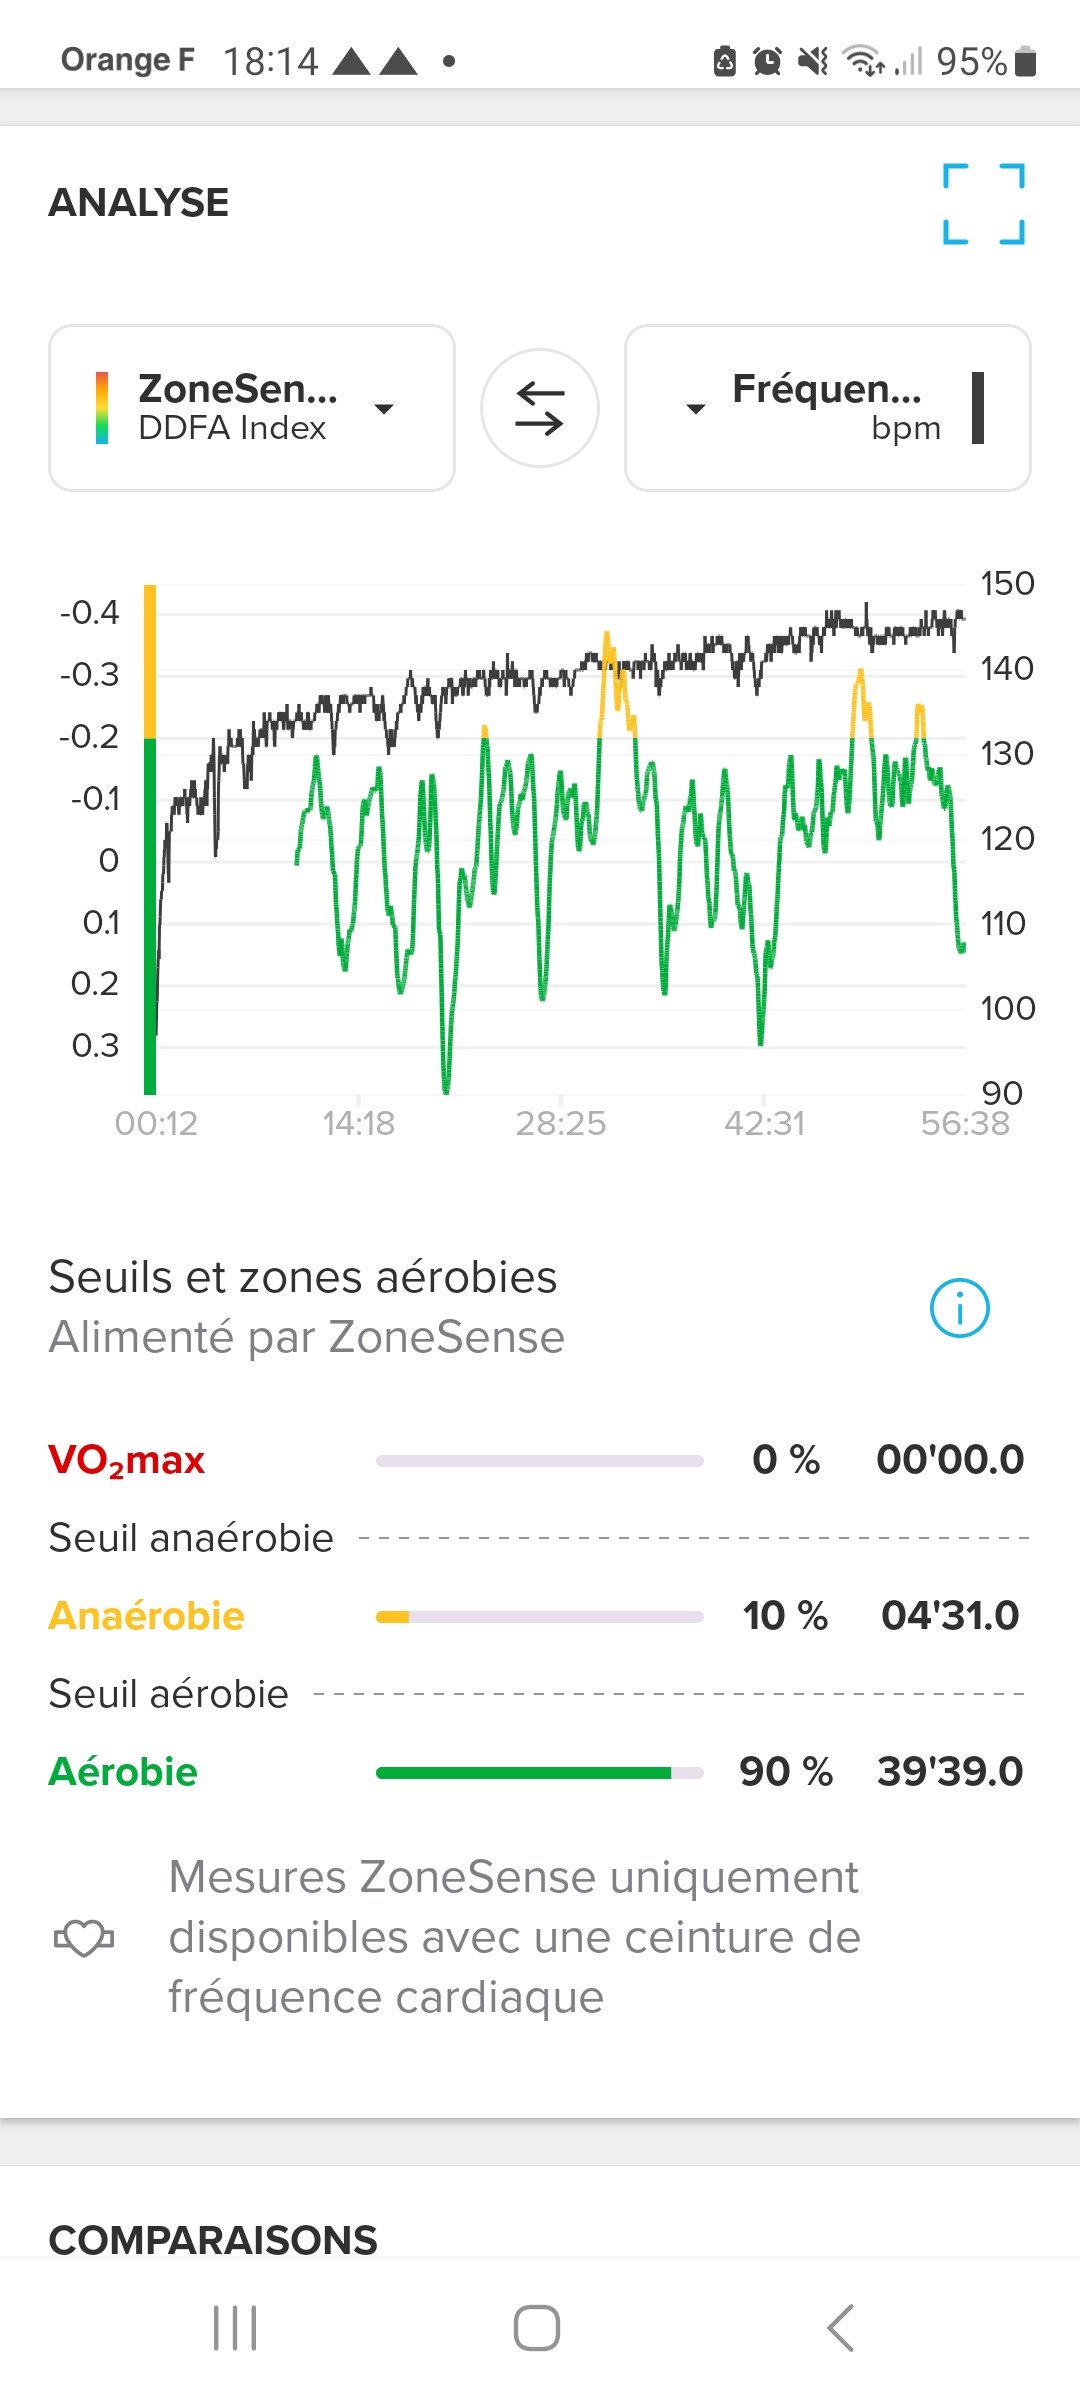
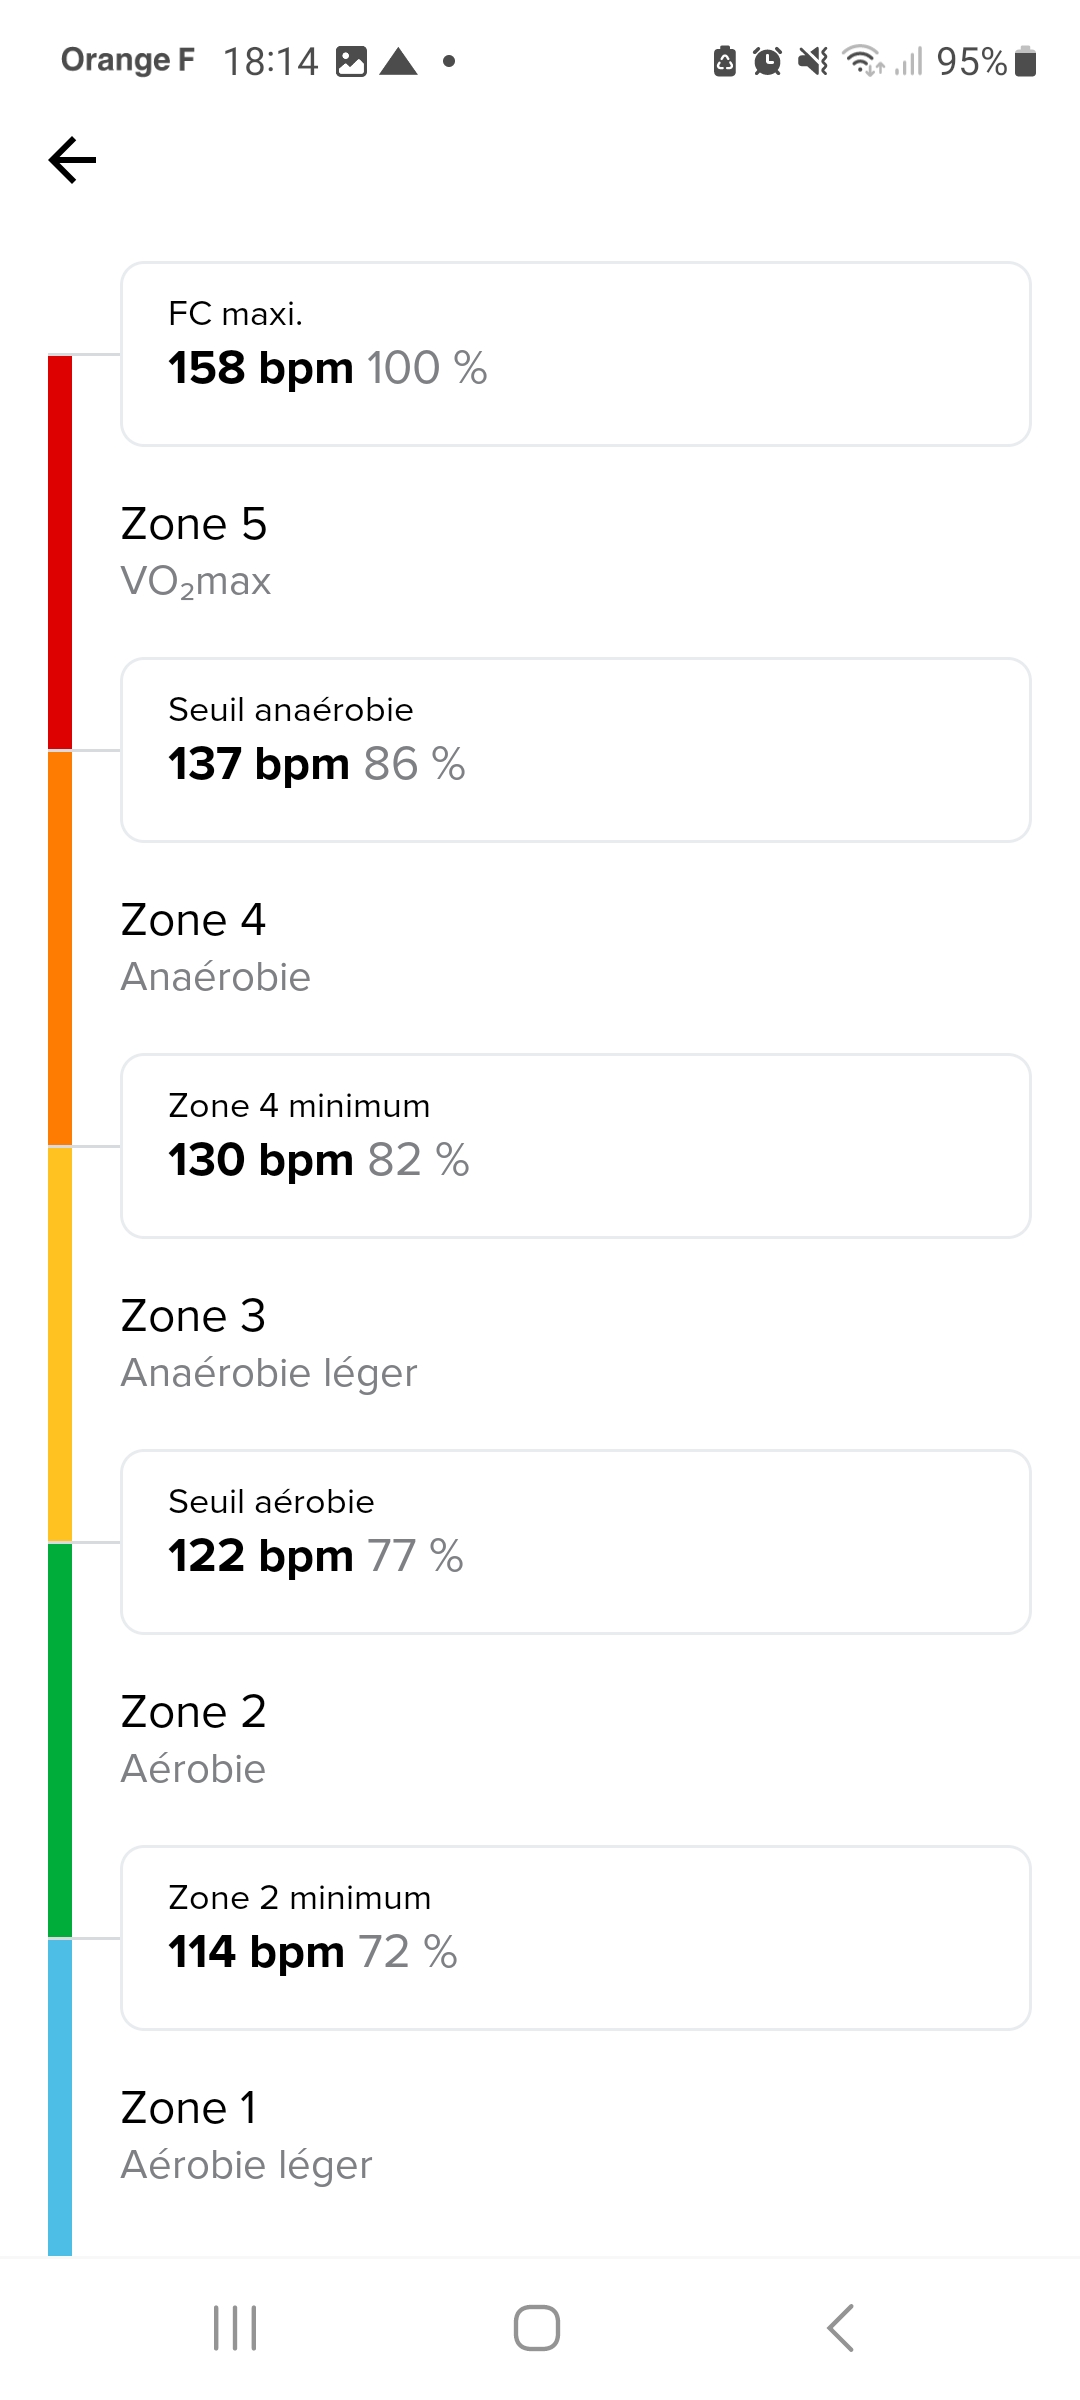
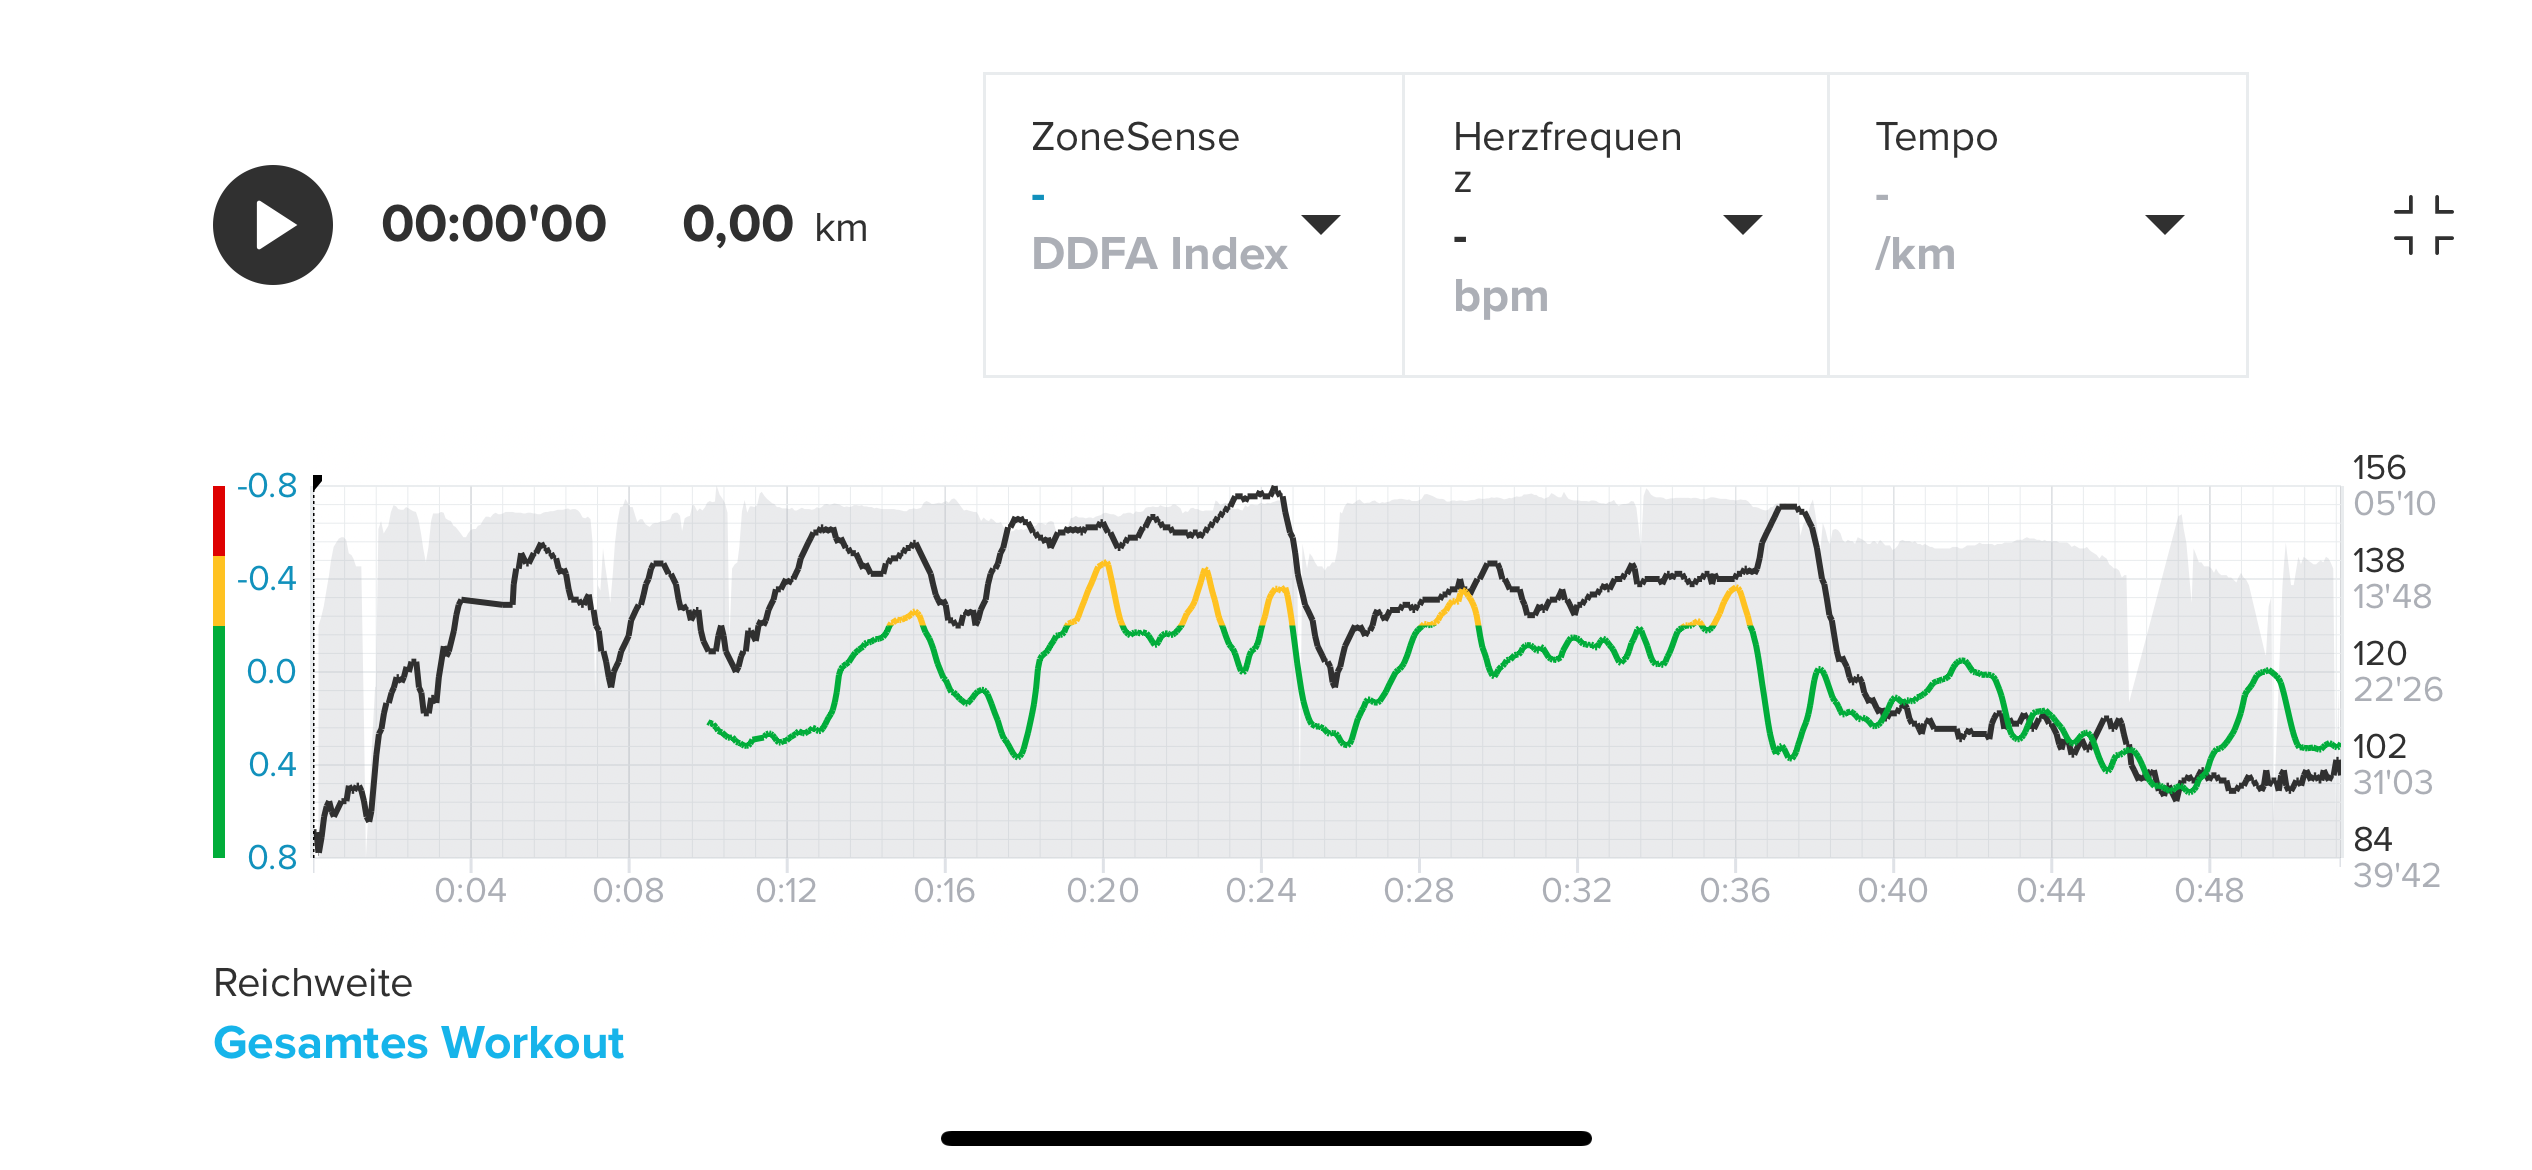
Hi, I started using the ZS some months ago and I quite intrigued by this new kind of analysis of the HR data. However, I find difficult to understand the results I get. The following graphs refer to the cardio activities I usually performed at the gym: I wear the Suunto smart HR belt at home and walked to the gym and back, so the “real” activity is the central part where the HR goes up. I wonder why in my case the ZS seems to be nearly anticorrelated to the HR data, going usually down during the more intense part of the recorded activity. Maybe the initial part il too long or too easy to correctly trigger the ZS detection? Any hint?
At least, over 16 similar activities, I got 3 times consistent determinations of the Aerobic Threshold (133, 136 and 137 bpm)
Suunto Vector . Vector HR . Core . Race & Race S
-
@Brad_Olwin
How did you determine your max HR, it seems quite high at 67 !!
For me, I just applied the formula 220 minus age, and increased a bit the result, and all zone values computed by the watch are based on that, this is why they seem so low. -
@luke55 sorry, wrong post, cant delete
-
@luke55 said in Zonesense difficult to understand:
@Brad_Olwin
How did you determine your max HR, it seems quite high at 67 !!
For me, I just applied the formula 220 minus age, and increased a bit the result, and all zone values computed by the watch are based on that, this is why they seem so low.I add a few bpm to my max for the last few months. Last set of uphill intervals I did the max was 178 bpm three days ago. Been routinely hitting 177 on these so 180-183 is probably about right. That is how I determine my max.
BTW I am 68 now.
Using age calculations is a bad idea IMHO, they are usually way, way off.
-
Out of coincidence, does Zonesense only work for long, steady efforts? I do a lot of HIIT and Hyrox training, and I find that my feelings and regular BPM correlate, but Zonesense will show me as working mainly aerobically.
Equipment: Suunto Race Titanium
SA: Android (Beta) -
@Steven-Limmer said in Zonesense difficult to understand:
but Zonesense will show me as working mainly aerobically.
that happens to me too (see my previous post)
-
@Steven-Limmer said in Zonesense difficult to understand:
Out of coincidence, does Zonesense only work for long, steady efforts?
Yes. ZoneSense needs about 2 minutes to catch up with reality.
-
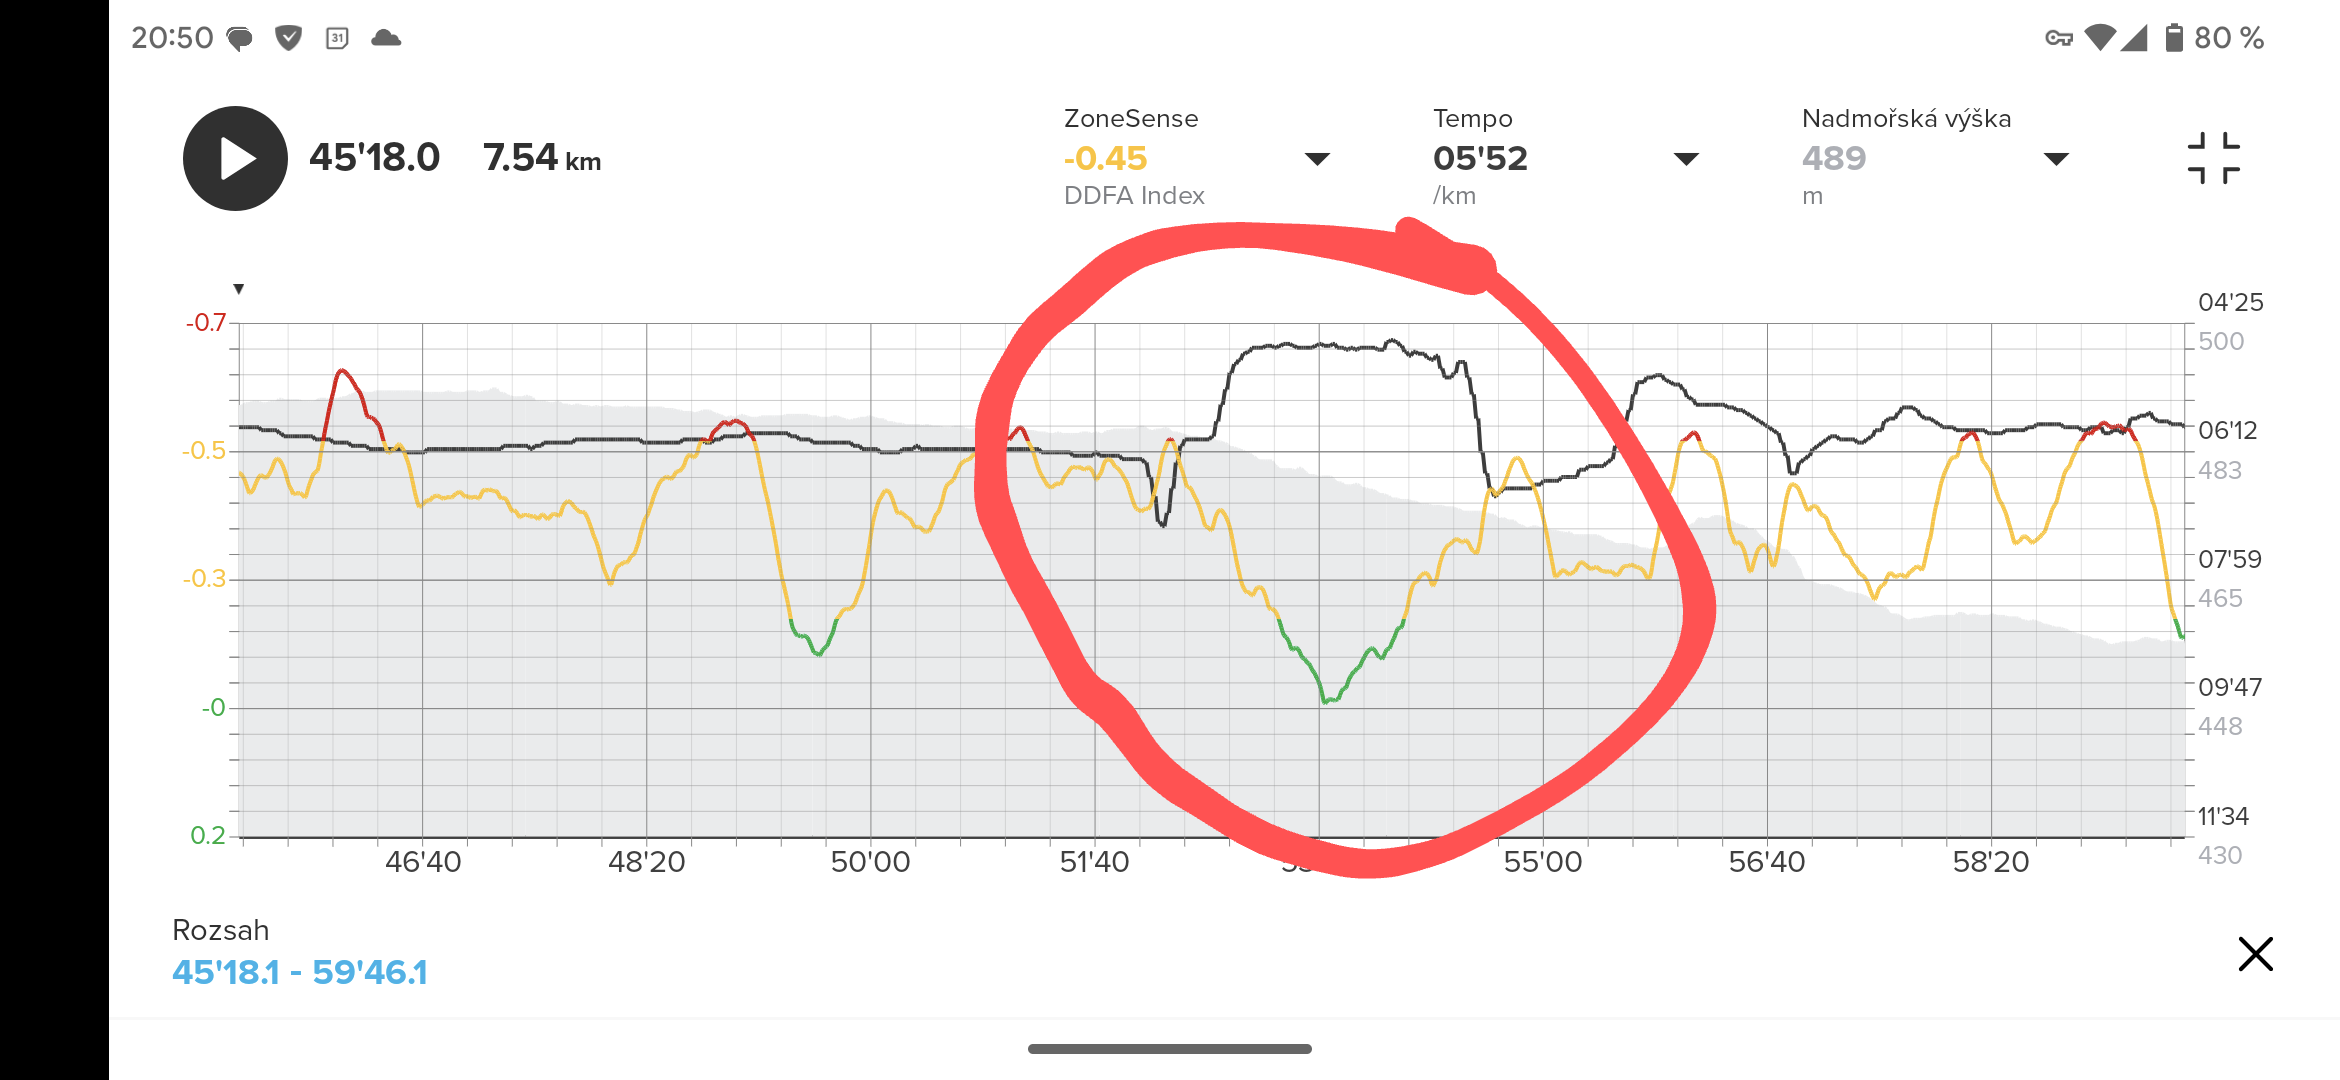
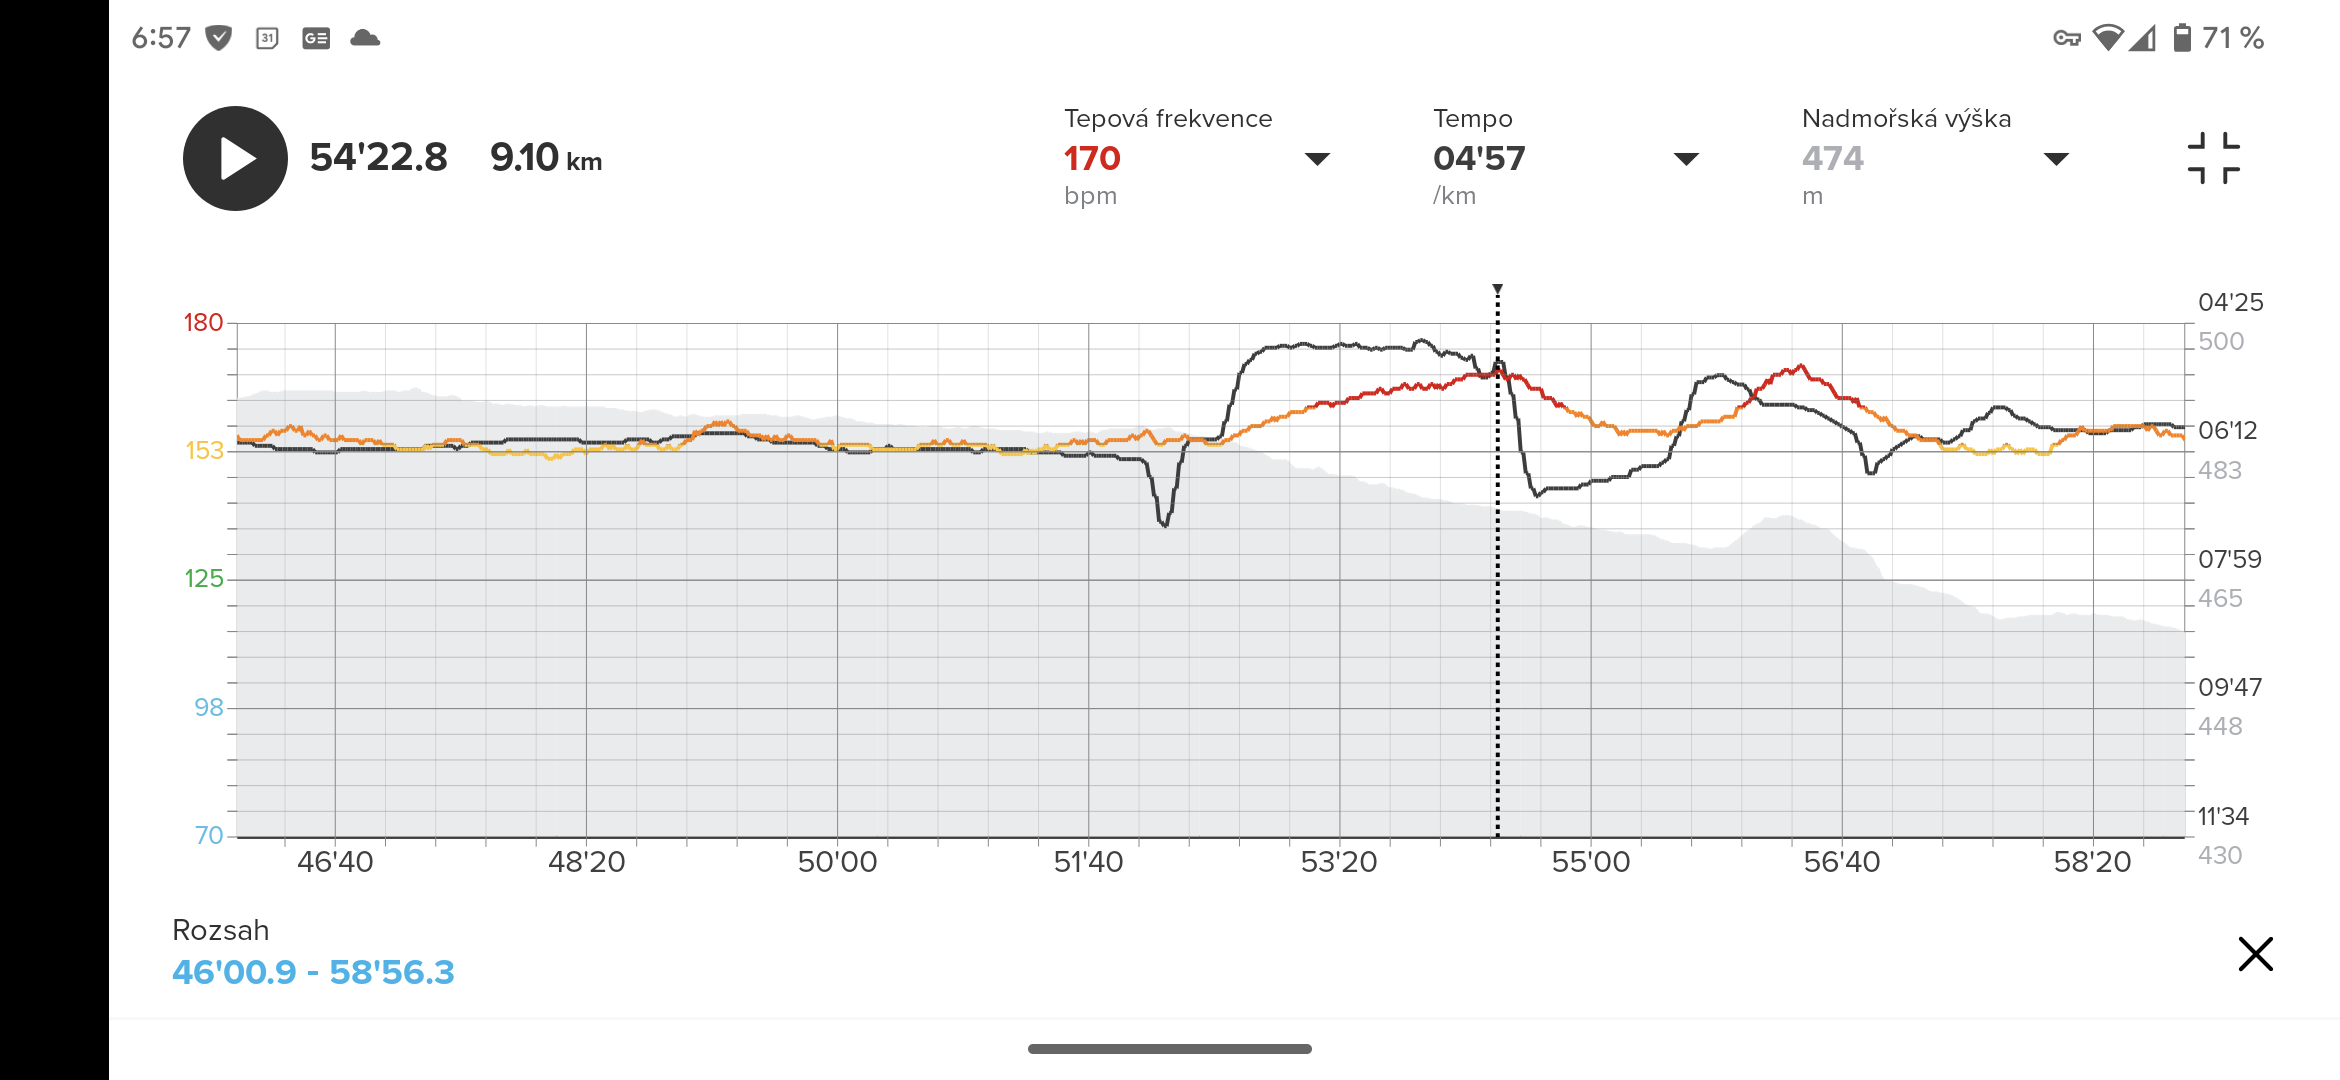
@Stefano-M64 I have a similar experience. Big acceleration in the last kilometer and a drop in Zone sense.
-
@Jan-Suchánek You are going downhill! I bet HR drops or does not change, this seems fine to me. This is a very short segment maybe a bit over 2 min or 3? Not what ZS is designed for. You can find a lot of information about ZS in the videos on this thread.
Vector/T6c/Ambit 3 Peak/S5 Copper/S3/S7 Ti/S9 baro Ti/S9P Ti/S9PP Ti/Vertical Ti/Race Ti/RaceS/Ocean/Wing/Race2Ti
-
@Brad_Olwin No, you’re wrong. This part was 400m long with 10m descent. Almost flat. My pace raised from 6:10 to 4:50 and my HR raised from 153 to 170 at the end of interval.
-
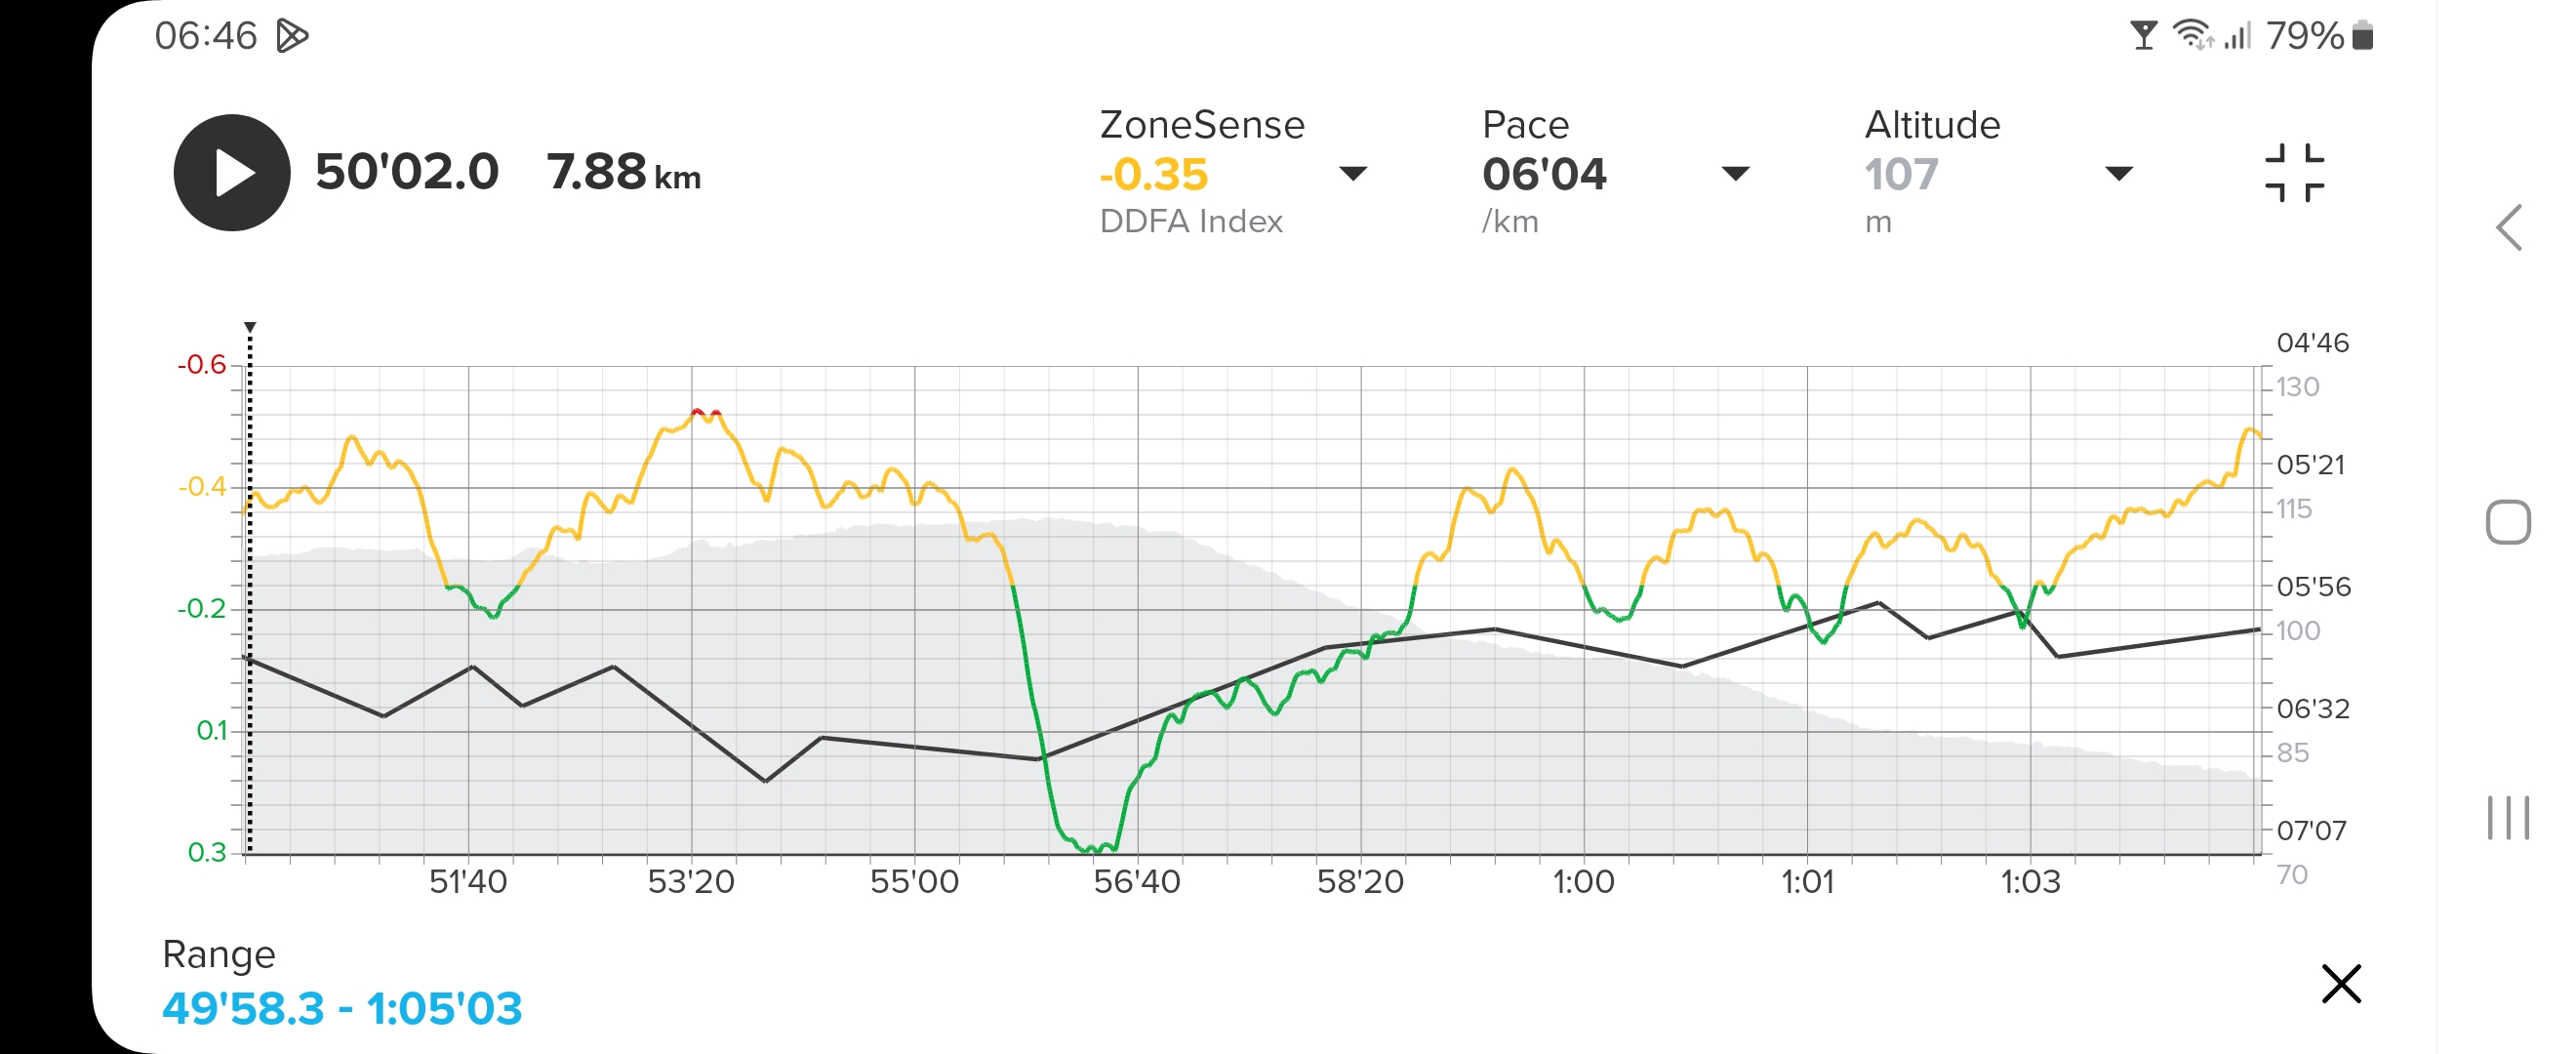
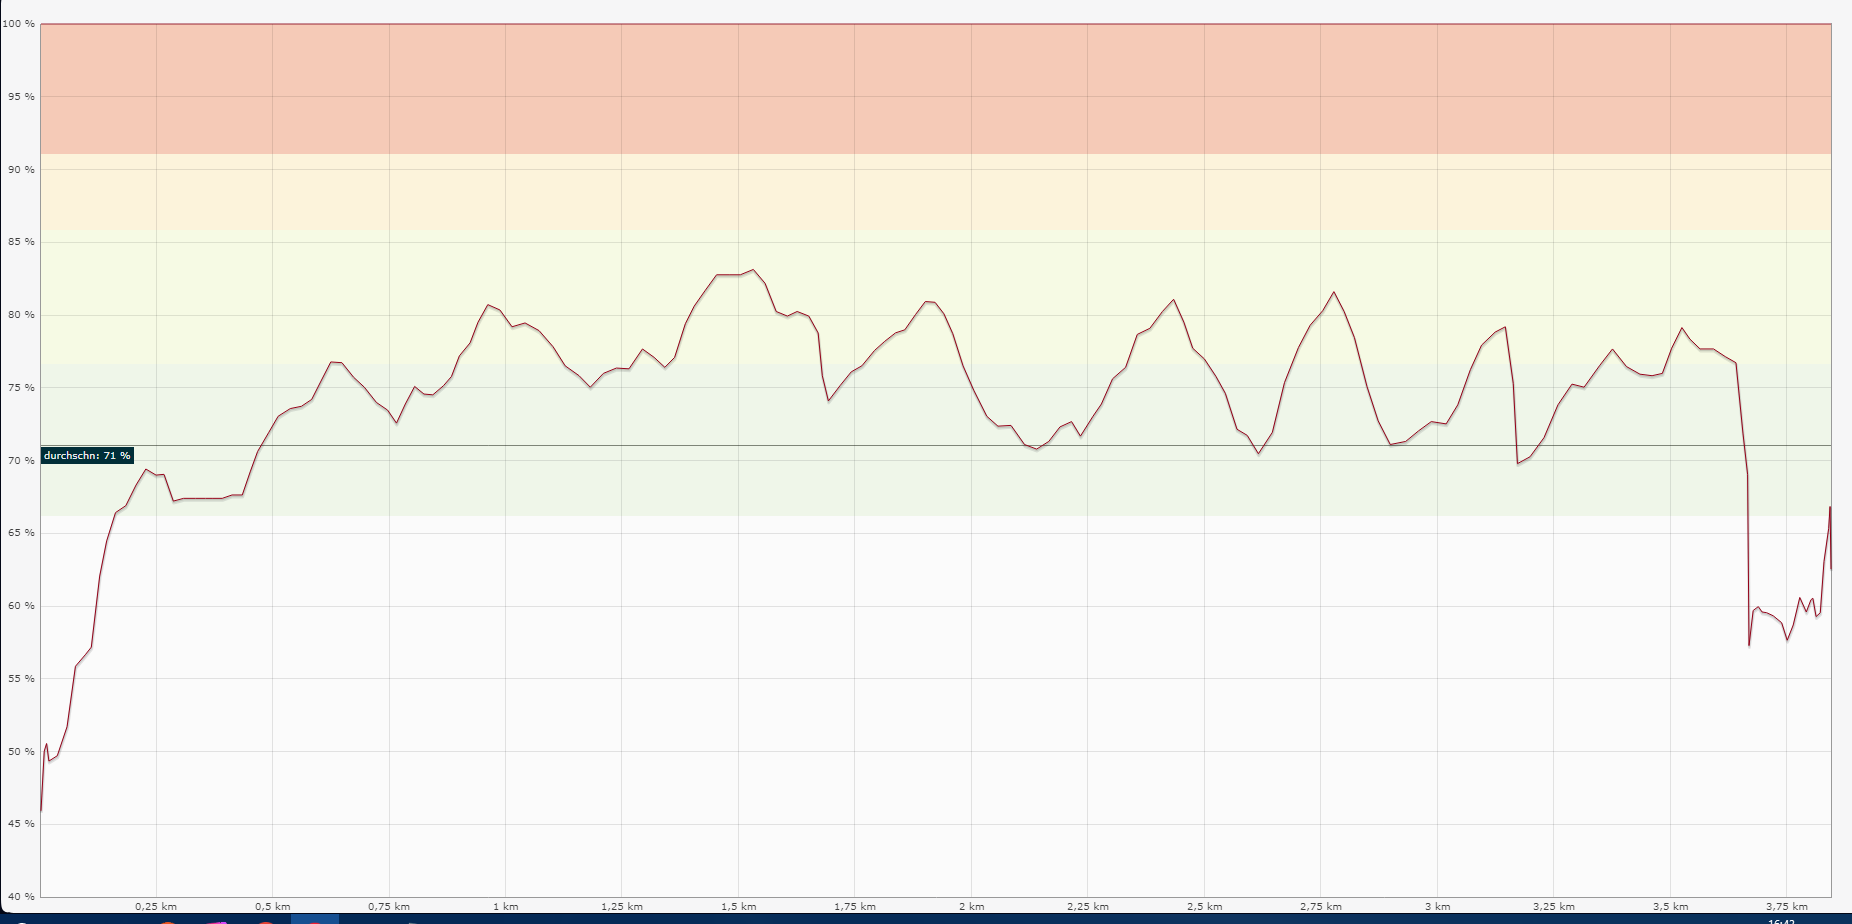
@Brad_Olwin Sorry for a bit off-topic but since you have so much experience with Suunto watches and the app, do you have any idea why my pace curves in the SA are so coarse? In the below screenshot I’ve set it up exactly like Jan’s shot (and this is on Android - which I think his is as well) with a 15 minutes window.
Granted that his pace scale is about twice my own, but that shouldn’t make such a difference. My pace data looks like it only have sporadic data points, but I’ve examined the .fit files and the ‘speed’ entries are logged every second and have normal variations.
I’ve never seen a finely plotted pace curve since I bought the Race S in Dec 2024.
Edit: The pace information while running, on the watch, is without any surprises and shows normal second variations. It’s just the graphs afterwards that lack definition, and frankly make them impossible to use for any insight as to what I actually did speed-wise:
Suunto Race S
-
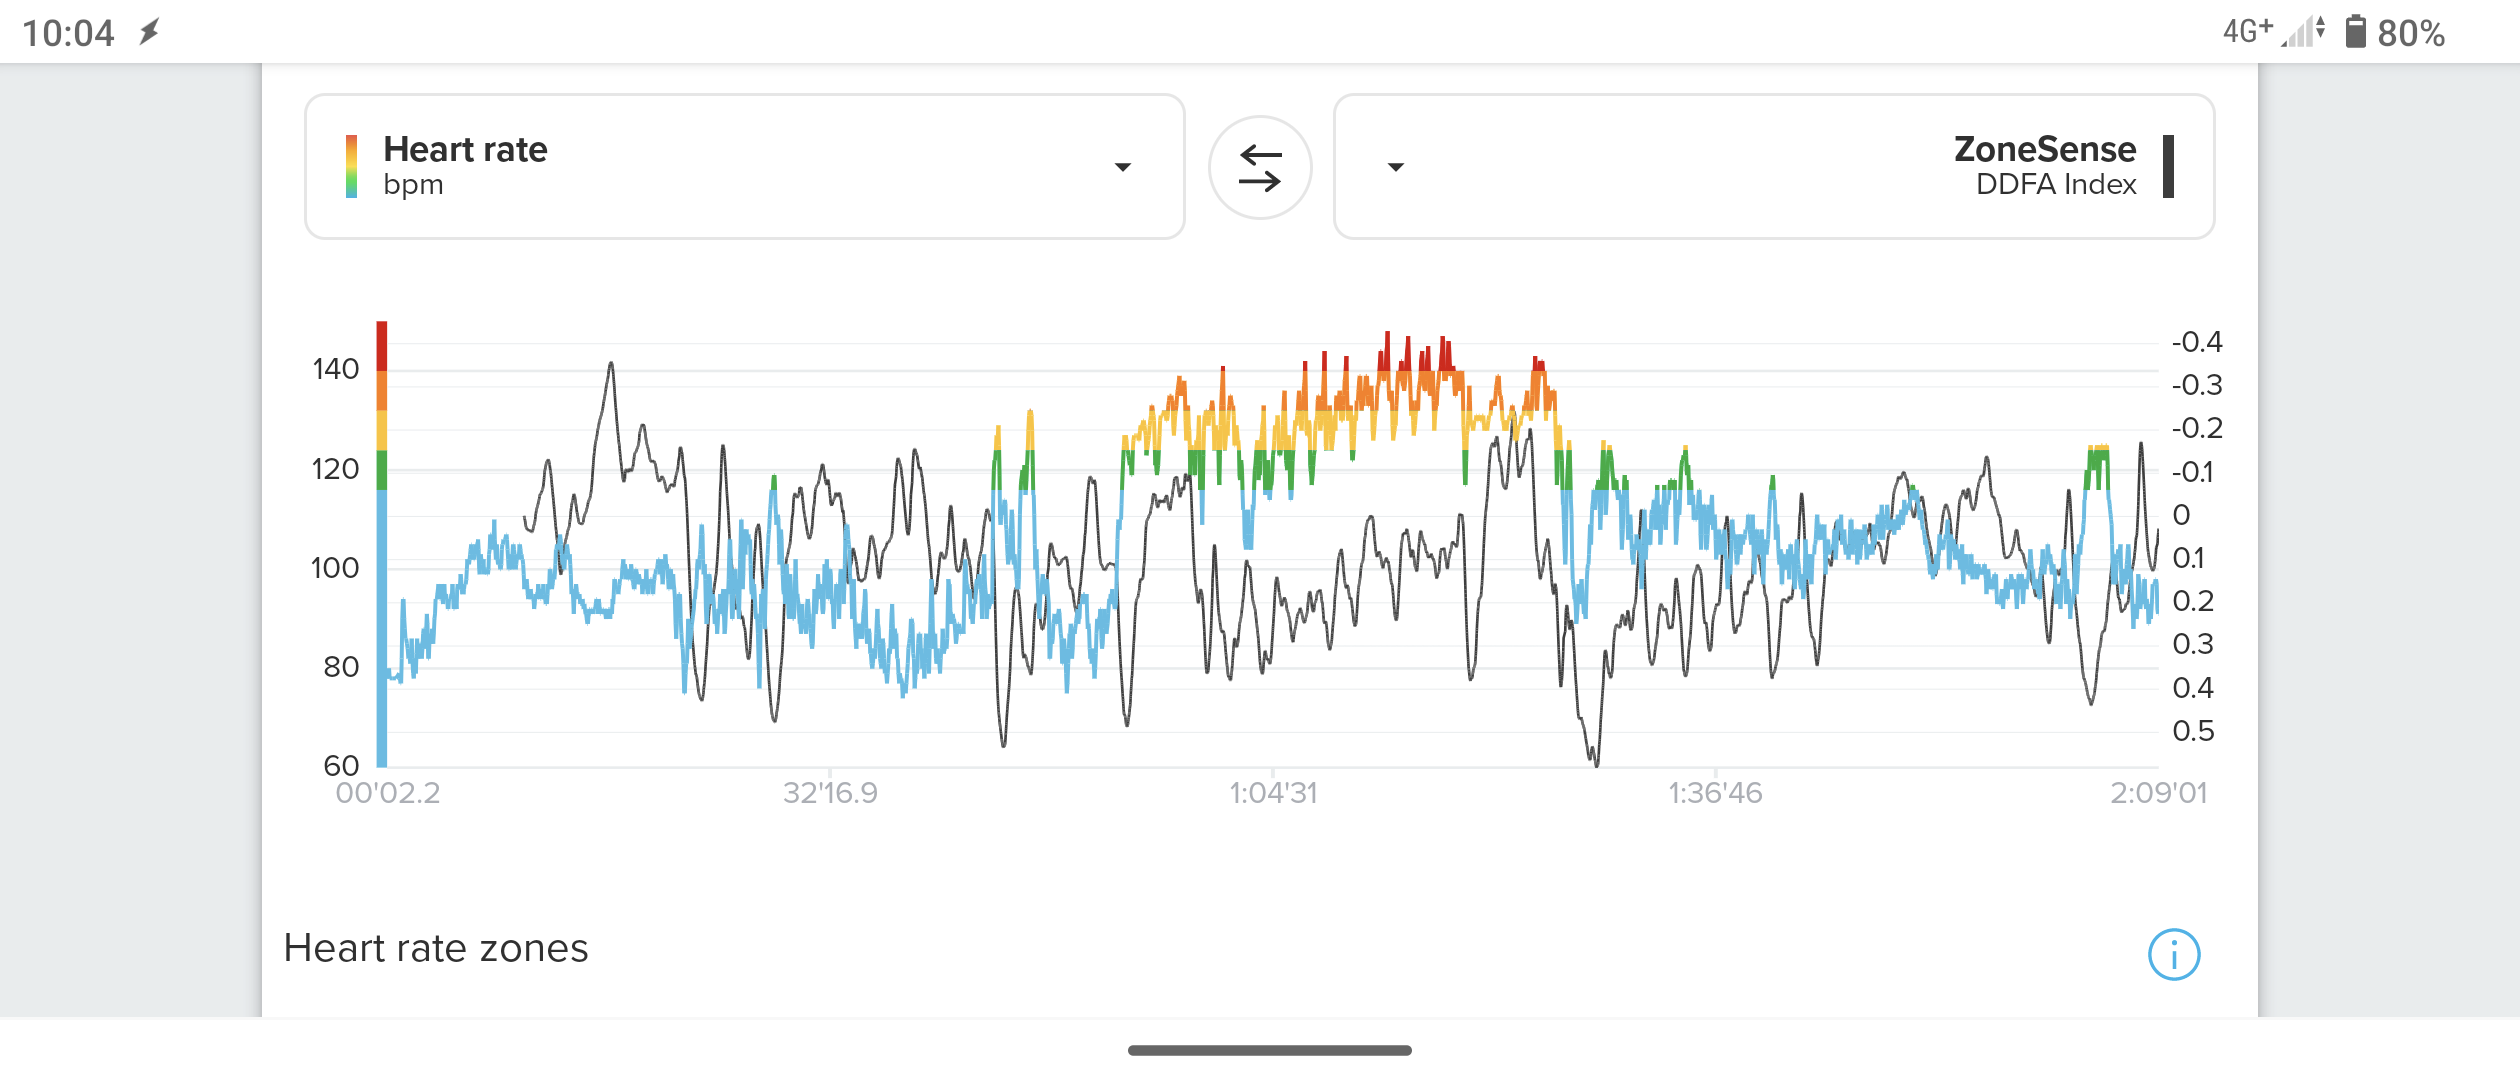
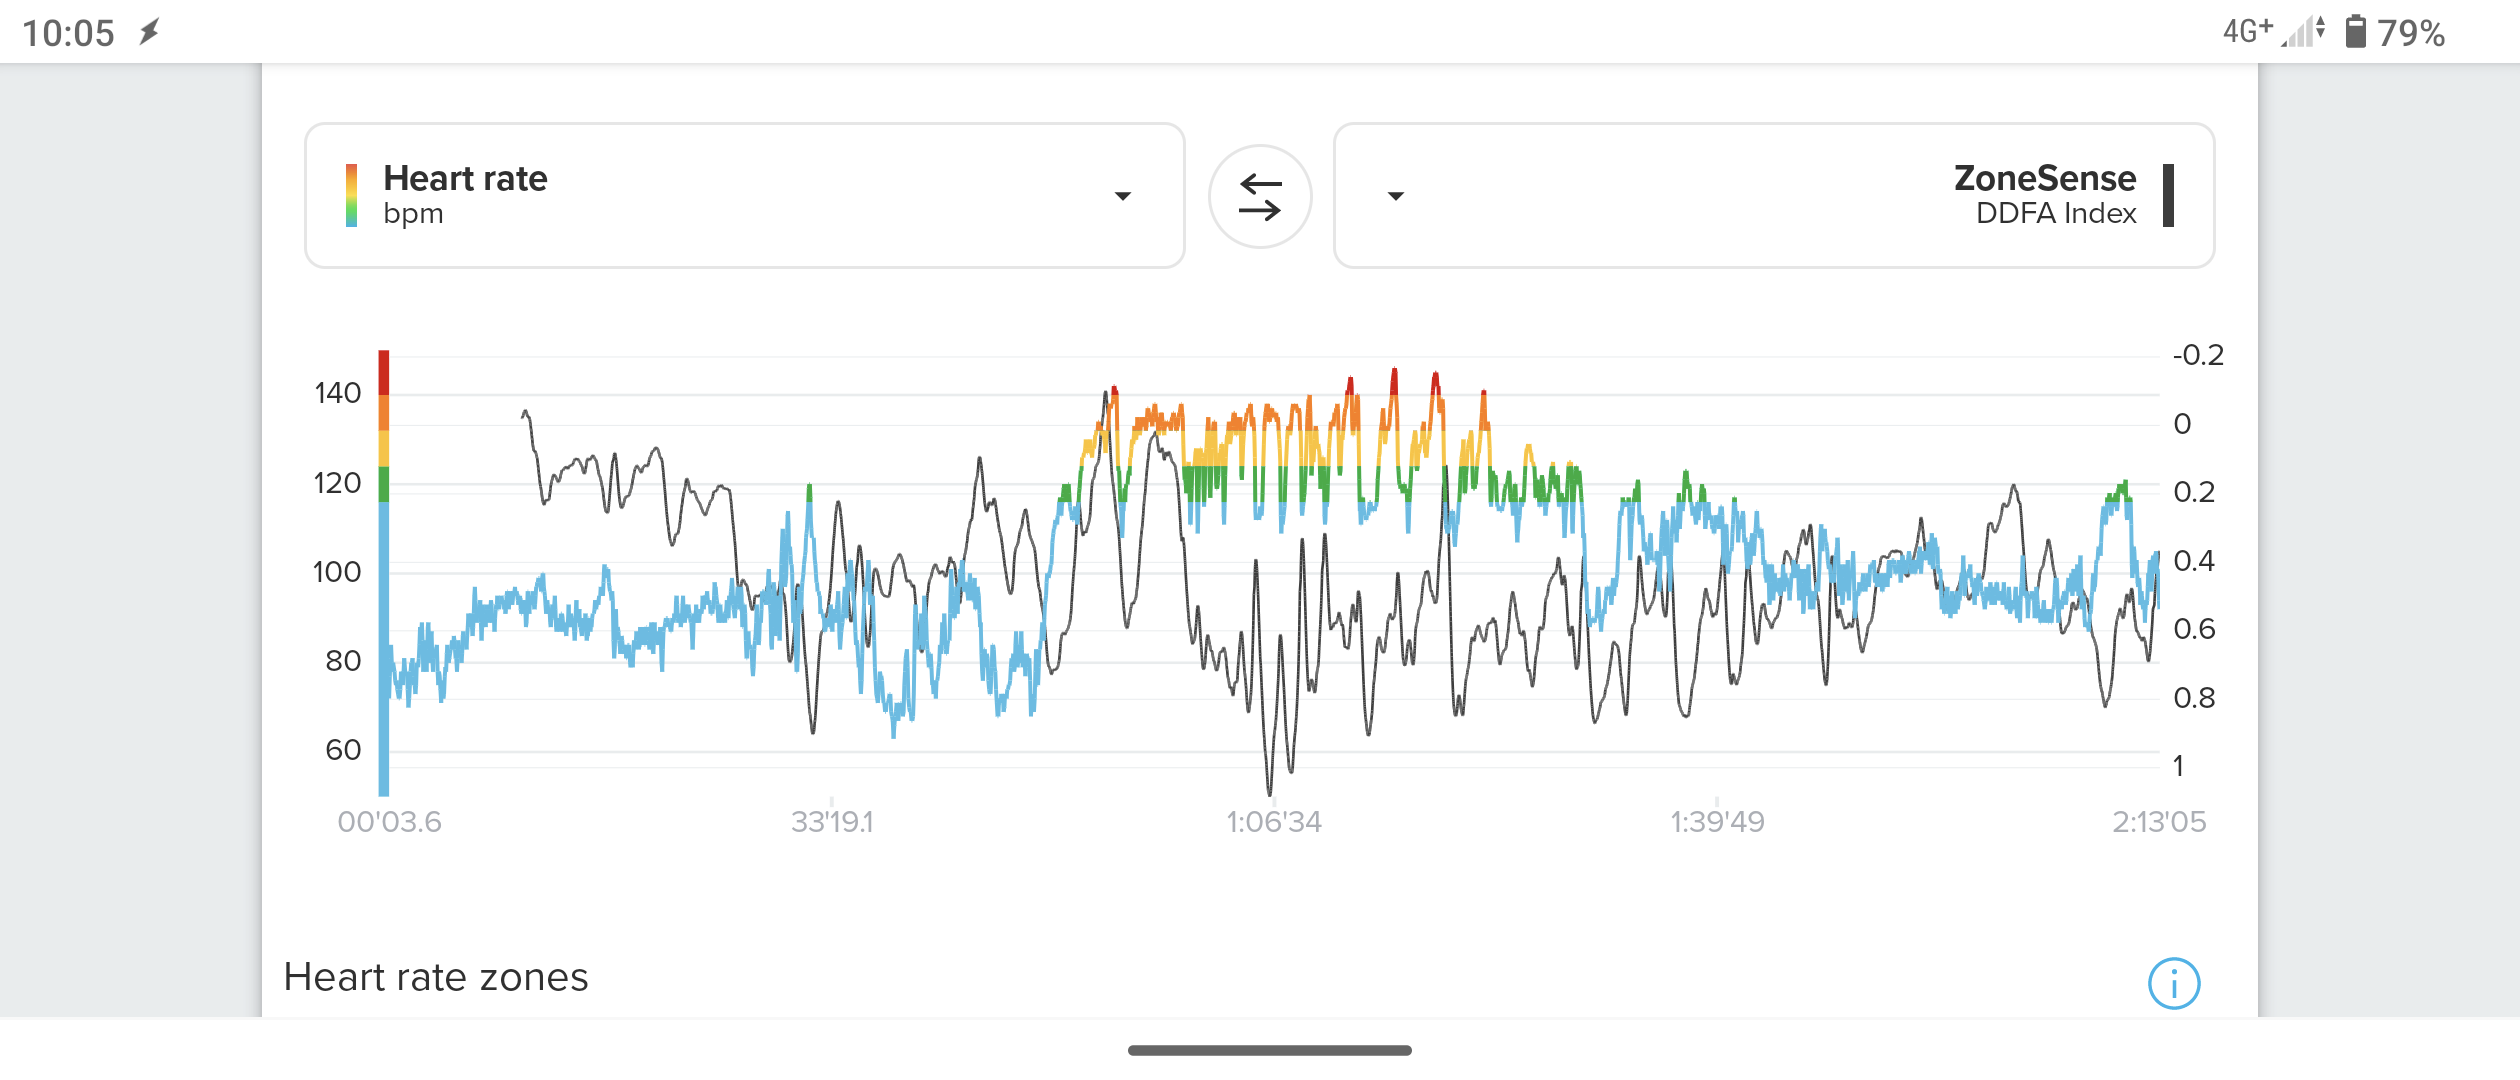
Those are results from some runs lately. Im not fit in the moment cause off a herniated disc. So no v2Omax at the moment. At the first picture it looks like zone sense has a negativ correlation to the HR but if you look at the other ones it looks more like the Zone Sense diagram is shifted to the left or to the right on the last picture.
Haven’t done a run after the latest update I think.
But maybe some with more insider oder sientific background can clarify this.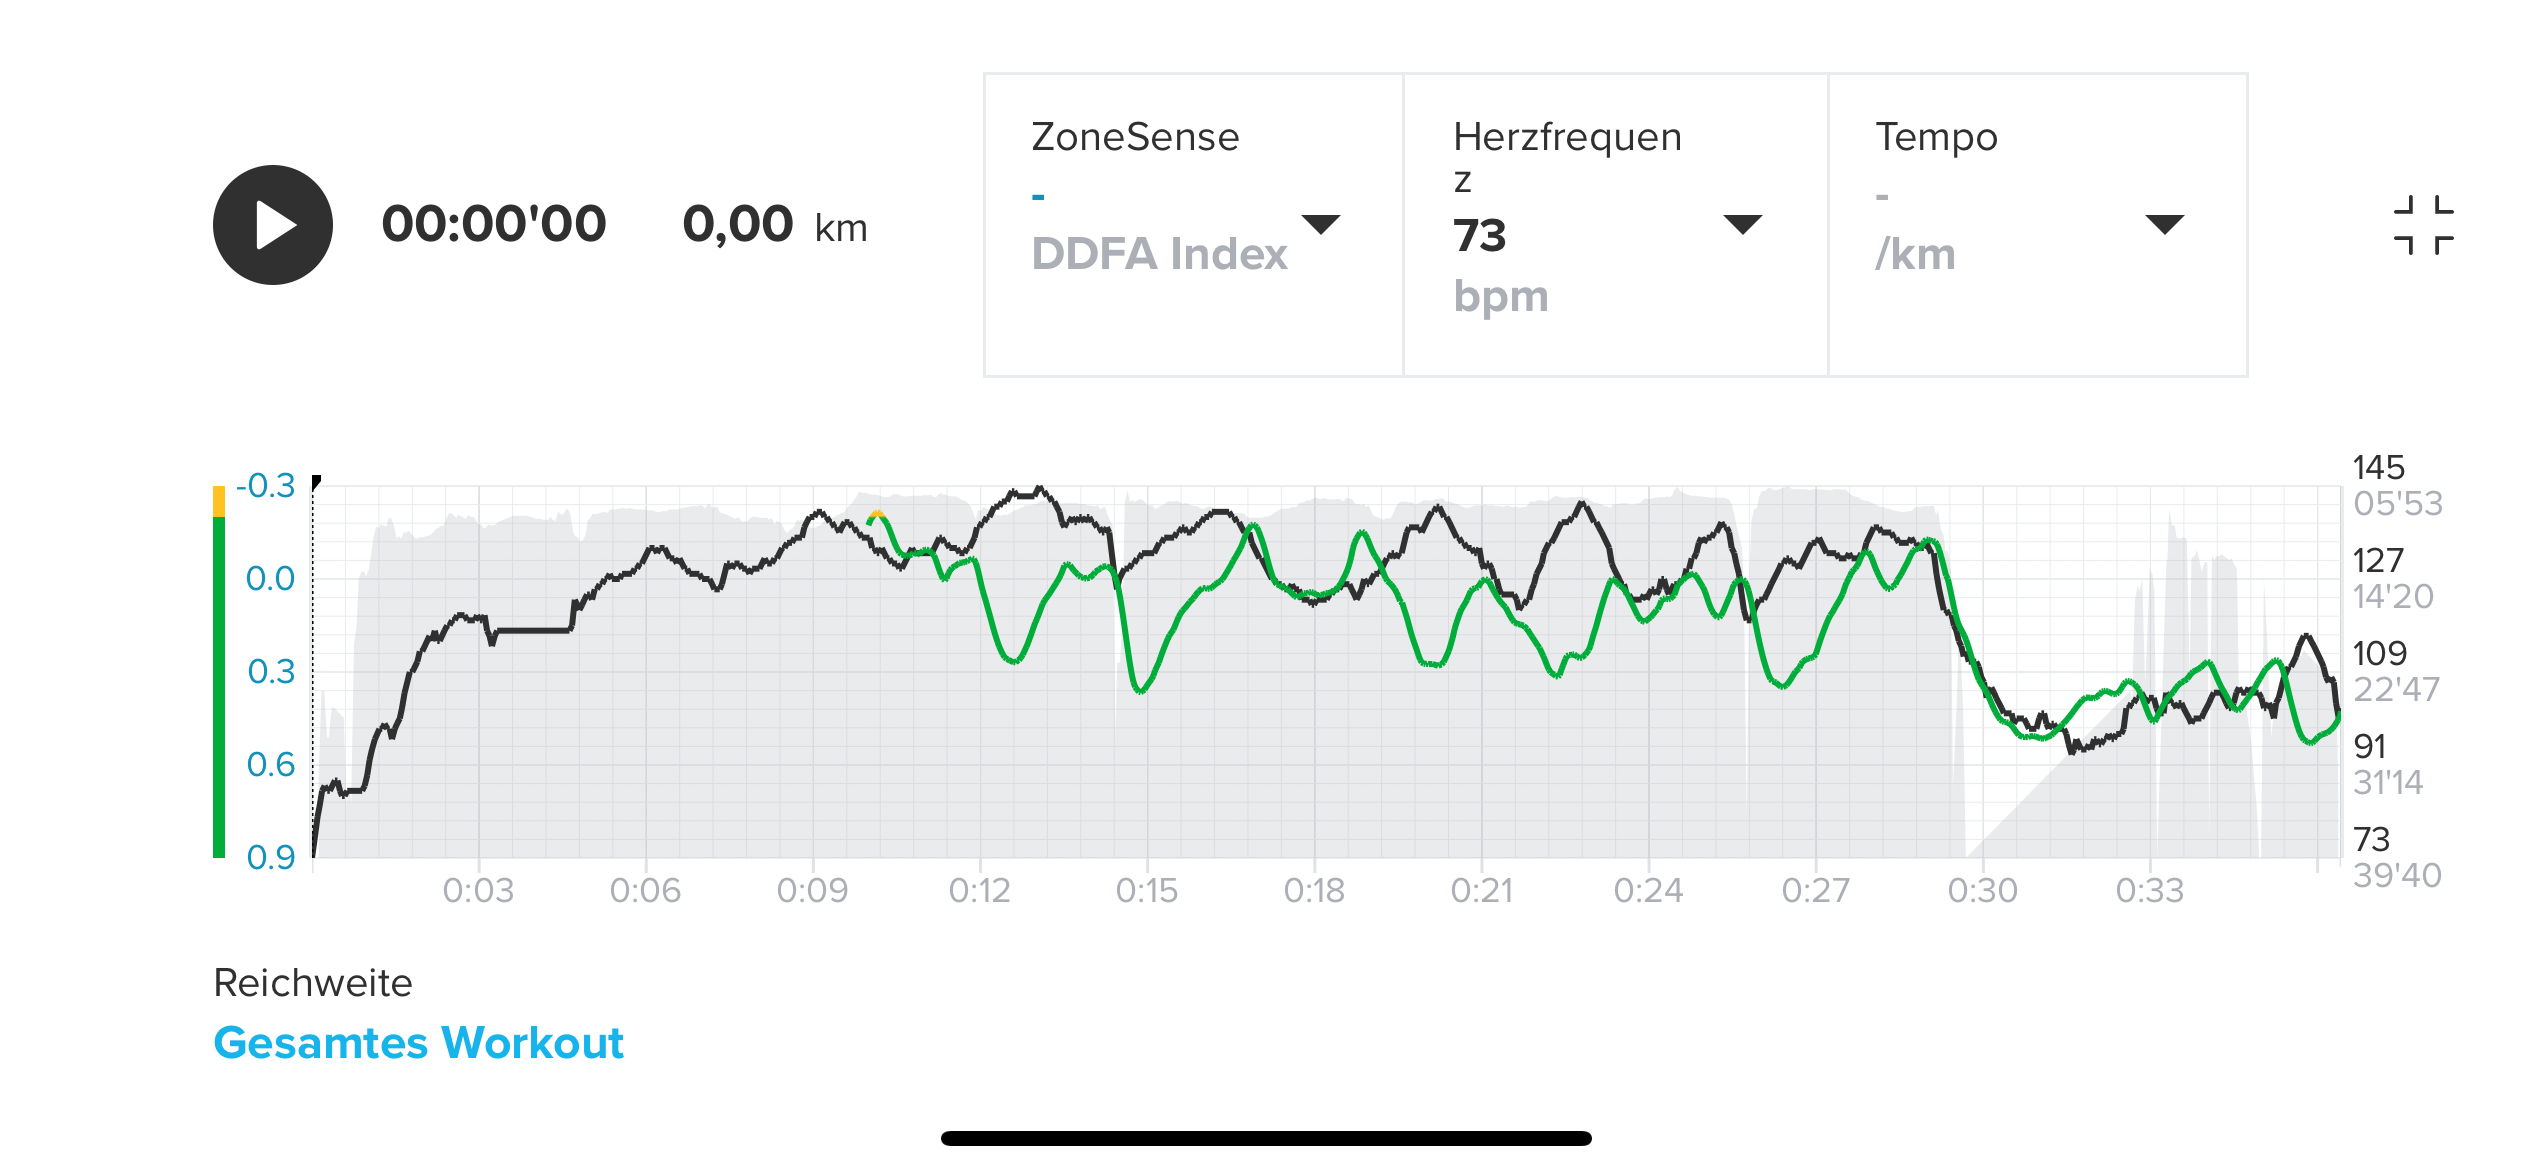

https://www.strava.com/athletes/37982563
https://www.instagram.com/macdev -
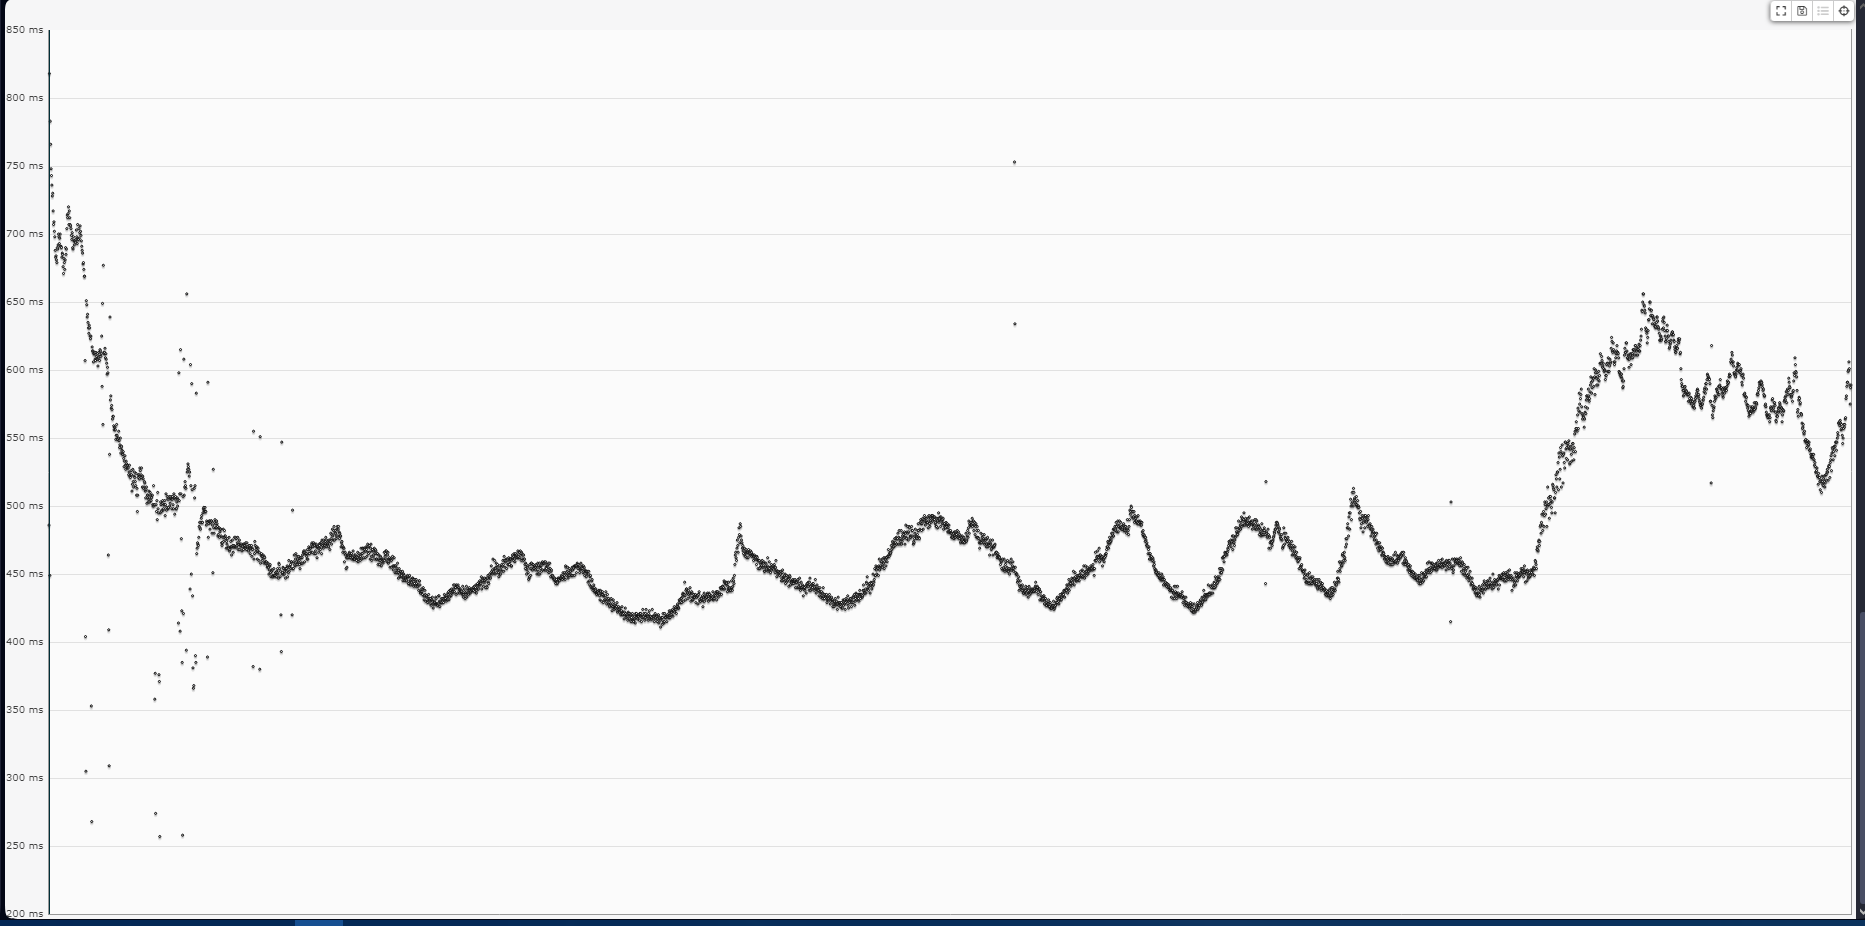
Here the “raw” data vizualized in runalyze for the first run (latest). I think the chart map better to each other. So maybe there is some kind of shift in the app.
-
@Jan-Suchánek So, I think ZS is working appropriately here. When you start the downhill run, ZS dips as does your HR. Continuing the downhill your HR rises faster at first and then less with a final rise before you reduce effort. ZS takes some time to respond as is well documented here and well documented in the videos. Your interval is quite short! A bit over 3 min?
During the initial drop in HR when you start downhill ZS decreases as expected, then as you continue to increase effort with a 1 to 2 min lag ZS then continually rises and peaks after you reduce effort, again consistent with how ZS works. So I see nothing wrong here.
You are expecting ZS to be HR or mirror HR and ZS does not do that. It is a calculation based on R-R. Your interval is very short and I as well as many others and Suunto state the ZS is not appropriate for short intervals.
I and others here have to keep repeating this point as well as repeat that ZS is not a proxy for HR. If you watch the videos you may get a better appreciation for how to employ ZS in your training.Vector/T6c/Ambit 3 Peak/S5 Copper/S3/S7 Ti/S9 baro Ti/S9P Ti/S9PP Ti/Vertical Ti/Race Ti/RaceS/Ocean/Wing/Race2Ti
-
@Ecki-D ZS is not supposed to correlate with your HR, repeated often here! Watch the videos, the long ones.
-
@Inge-Nallsson Can’t help you here as I have iOS.
Vector/T6c/Ambit 3 Peak/S5 Copper/S3/S7 Ti/S9 baro Ti/S9P Ti/S9PP Ti/Vertical Ti/Race Ti/RaceS/Ocean/Wing/Race2Ti
-
@Brad_Olwin Thanks for Your time and answer! You’re right, the interval is short and the ZS seems to be affected with slowing down before it. I know, that it has nothing to do with HR. I used AlphaHRV before.
-
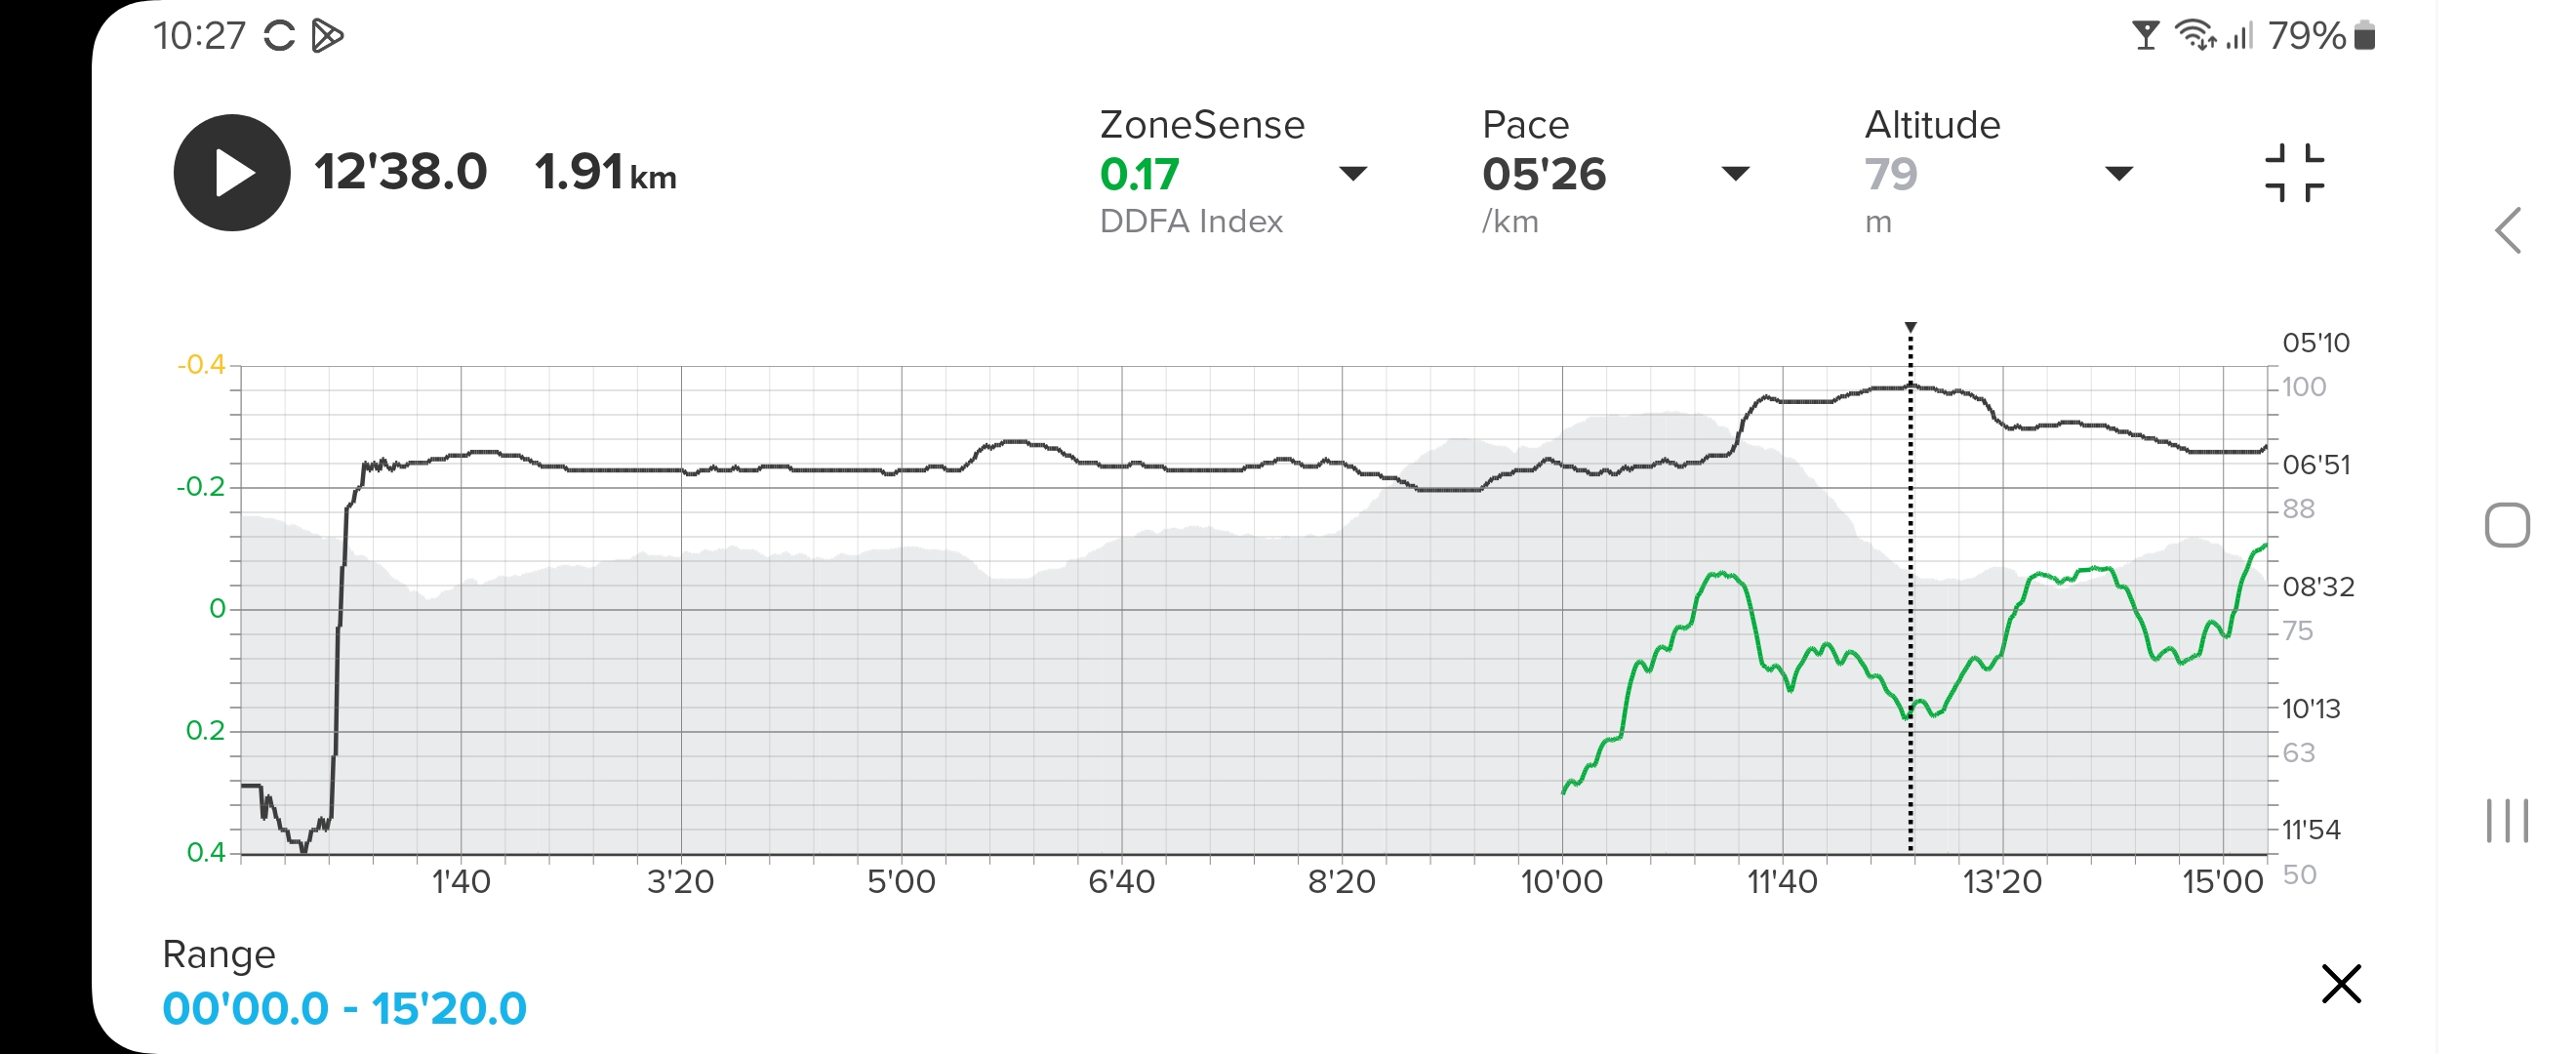
@Brad_Olwin Did an experiment today by deliberately walking the first 30 seconds of a recovery run and the resulting pace graph became butter smooth even when zoomed in to a one minute window. Walking pace was ca 12:00/km and the fastest run pace 5:26/km.
This is a very strange app behaviour. Perhaps I should bring it up as a bug in the android section of this forum… But for now a ‘bug fix’ would be to end every run session with some 10 seconds of walking.
The below screenshot is of the first 15 minutes where both the walk and a pace increase are properly discernable:
Edit: Found a conversation about this in the ‘login-locked’ Android section from two weeks ago. Added my own comment today:
“Android - Bad plotting of Pace time graph”
https://forum.suunto.com/post/163977Suunto Race S