Export R-R Data S9 Baro
-
From EliteHRV
What are R-R intervals?
Heart rate variability (HRV) is NOT heart rate. HRV is a powerful biomarker that has helped hundreds of thousands to:Improve training and recovery
Get fitter, faster and stronger
Get healthier and address chronic disease
Manage stress
And much more!
Key to its power is HRV’s deep connection to your nervous system, which controls and responds to many important body processes.This connection depends on tracking small changes (milliseconds) in the intervals between successive heartbeats (Fig 1), also called “RR intervals”. This is different from heart rate, which just averages the number of beats per minute.
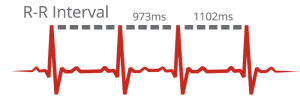
Fig 1: Heart rate variability
To measure HRV, you must have a compatible heart rate monitor that accurately senses RR-intervals. Many monitors do not meet this standard because:
They were not designed with HRV in mind, and do not have the required accuracy. Most wrist-wearables (watches, etc) fall into this category.
They record RR-intervals but artificially “smooth”, average or alter them before transmitting to us. Our app tries to alert you when this happens with a reading. -
Suunto provides this data R-R in Movescount
But it can’t be exported, nor analysed
-
What you are looking in Movescount it’s the Respiration Rate not what you want to get out of this.
I am quite familiar with RR data and have worked a lot on them as the best description would be IBI.
Makes sense?
-
So movescount has on the graph the respiration rate not the RR intervals (IBI)
I don’t think you want to export that. You can use the belt to get that data to EliteHRV no >?
Community Manager / Admin @Suunto
Creator of quantified-self.io a portal that allows you to analyze your data from various providers, upload fit activity files to Suunto app, gpx routes and more… -
@Dimitrios-Kanellopoulos dont’t think so.
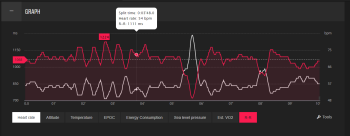
Movescount has heart rate beat to beat (R-R) in the graph.
1111ms between the beats corresponds nicely to 54bpm. -
@Egika hmmm then you are right I though I was seeing the Respiration rate.
These RR are recorded by the watches but not sure if they are exported.
Also this forum is not about movescount atm.
The load guys is getting quite big so please lets avoid any movescount support requests here
-
From Suunto:
Dear Marcel Balino,
As for the calculation, I do know of is that they use a BPM/HR reversal plus a laboratory gathered statistics for the algorithm they used for the calculations, and yes, it is only an estimation, since each of us has different characteristics and the algorithm used is universal.I don’t have heard of any news for downloading all the date from MC, but don’t worry I can forward this one for you, as I have been asking this one with our team, that if we can download the filtered and estimated data from Movescount as well not just the raw data, like we have now.
Hope this helps you.Have a great day ahead!
Sincerely,
Kirk
Suunto Customer Support Team -
@Marcel-Baliño , you can access IBI (R-R) data through Tools -> Export as XLSX in Movescount Move view, last column includes raw IBI. I’m assuming you are using a Suunto Smart Sensor for HR. Some optical HR devices do report IBI, but it tends to be “fake” - calculated from HR, which in turn is usually filtered.
Movescount R-R graph has not much in common with “real” IBI values. That data series is calculated from HR graph data, which in turn is already down sampled for graphing purposes. I’m also bit skeptical about that “plus” part regarding statistics in the response you got, but you (or anyone else) can prove me wrong by finding a single HR + R-R plot in Movescount, where at least one RR[ms] value is not equal to 60000/HR[bpm].
Movescount HR + R-R compared to simple IBI scatter plot from the same activity :
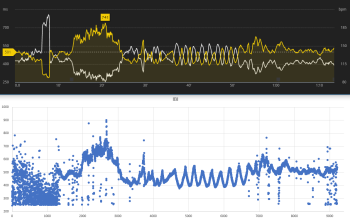
There’s not much practical use for this other than spoting noisy sections most likely caused by dry contacts and statics in clothing, but if you are after IBI values, you have probably found your way to methods and tools commonly used for HRV-analysis.
-
@margusl so they have eg:
- Get HR (from IBI or OHR etc)
- Display it with its filtering -> HR on chart
- Create the R-R from the HR of the chart?
-
@Dimitrios-Kanellopoulos , well… kind of
")
I’m still using only A3 and currently I don’t have any Moveslink2 sml & json files at hand to check. IIRC, if there’s IBI available, HR dataset is not even sent to Movescount, so yes - (1.) HR is built from IBI at MC.Maximum sample size for graphs seems to be 1000, so the sample interval for 7-hour Move is set to 26s, (2.) they probably do some extra filtering there, but there is some HR averaging for sure for anything longer than 1000 seconds (17 minutes )
And when you enable R-R chart, MC just plots the multiplicative inverse of HR chart data set, that very same that has no more than 1000 samples and can have 26 or so seconds for sample interval.
i.prototype._createRRSamples = function(e) {
    var t, i, n = [];
    for (t = 0; t < e.length; t++)
        i = e[t],
        n[t] = i > 0 ? Math.round(6e4 / i) : null;
    return n
}
return !n.HeartRate || n.RR || null !== a && -1 !== a.indexOf("RR") || (n.RR = this._createRRSamples(n.HeartRate)), ...For me the R-R chart is one of the greatest puzzles of Movescount - why would anyone spec something like this? Implement it as it is? For who?
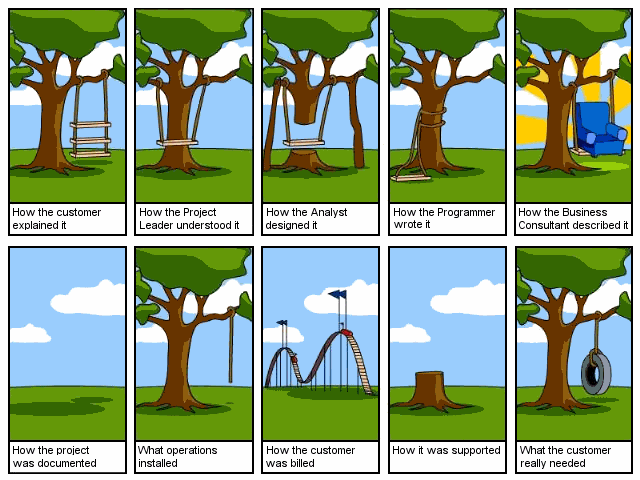
https://blog.codinghorror.com/on-software-engineering/ -
@margusl Usually on the IBI you apply the instant conversion to HR, you crop big and low values and then you do 1-2 rolling average filters. To normalize the HR graph.
However , IBI/RR should not derive from HR. They hold more information that the HR (which is kinda stupid imo but well).
But I can see perhaps why one would put that chart there, that should be due to showing that the value exists , even if it’s not an RR/IBI plot eg like Runanaluyze does .