[Good-to-know] Simulator vs physical watch: key discrepancies & limitations
-
Hello.
The simulator is generally more featureful and more web-standards-compliant than any of our watches. What this means is that especially your wildest HTML+CSS concoctions may appear fine when simulated, but not when deployed on hardware. That said, at times it is the watch which breezes through something that stumps the simulator.
The main goal of the simulator is to show an approximation of the GUI and to provide quick feedback on the logical parts of your application i.e. the JavaScript (JS) code and how it interacts with the GUI. Remember to stick to to the ES5.1 version of JS and to make use of the native functions (which you can find inside the reference documentation). One example of a native function is
setText, which you can see under ‘‘discrepancies’’ further below.We hope you share all additional findings – should you encounter any – in order to be of help to your fellow devs
") All of the following are true as of the time of writing:
All of the following are true as of the time of writing:Discrepancies
- Use
setTextinstead ofoutput.textField
output.textField = "some text" // Works in the simulator, but not on a physical watch setText("#some_id", "some text") // Works both in the simulator and on a physical watch- Zooming into images with CSS works in the simulator, but not on a physical watch
- The watches understand only basic CSS properties, such as
width,height,color,background-color,opacity,borderandvisibility- Border must be solid and on all sides
- Supported units are
pxand%. Other units may pass the validator, but will be treated aspx.
- Making changes to an HTML template right after it has been loaded will work in the simulator, but the watches may require some time between
unloadandsetText/setStyle.- One way to overcome this is to have the
evaluatefunction wait a cycle or two before making text/style changes.
- One way to overcome this is to have the
Simulator limitations
- Pause and resume do not work
- FIT file coordinates are ignored
- Currently, the simulator does not read any GPS data from FIT files. To test GPS-related features, please use a physical watch.
- An application’s settings, which would appear in the Suunto mobile app on iOS/Android, cannot be adjusted
- Any sound effects from playIndication() will not play
- localStorage doesn’t work correctly.
The screenshot feature is also in a non-functional state.
Again, please share any additional findings below!

- Use
-
D Dimitrios Kanellopoulos pinned this topic on
-
S SuuntoPartnerTeam referenced this topic on
-
@SuuntoPartnerTeam said in [Discussion] Simulator vs physical watch: key discrepancies & limitations:
The screenshot feature is also in a non-functional state.
I got access to the partner program. Upon uploading the app, I’m requested to send watch images by using the screenshot option. Is there any information about when this feature will be available?
Is it mandatory to use this feature or is a screenshot with the right dimensions also ok?
-
@surfboomerang said in [Discussion] Simulator vs physical watch: key discrepancies & limitations:
Is it mandatory to use this feature or is a screenshot with the right dimensions also ok?
not necessary use screenshot tool from sdk
-
S SuuntoPartnerTeam referenced this topic on
-
My app was working well on the Simulator.
When deploying I had to learn that I had to strip out debugging fields from my manifest cause of to many fields.
Further the app still crashes the watch when choosing it on the watch as a suunto plus app.
I tried to get infos from the logs and will now deploy minimal functional versions to the watch to get it sorted.
Is there a way to start debugging on the watch?
Would be great if there would be a pre deployment check of the code if there are hard incompatibilities. Maybe I missed something. -
@Ecki-D. there’s no debug protocol as far as I know. you could do it the oldschool way - use
systemEvent('[tag] message $someData');to populate the logs, using a ‘tag’ just makes filtering easier when you check the logs after a crash or whatever happened. -
@SuuntoPartnerTeam Simulator seems to have a problem in
getUserInterfacefunction. This works as expected:function evaluate(input) { systemEvent('distance', input.distance); }But this breaks the simulator, and “TypeError: Cannot read properties of undefined (reading ‘distance’)” is printed to developer tool console:
function getUserInterface(input) {
  systemEvent('distance', input.distance);
  return {
    template: 't'
  };
}
Both work in watch.
-
Struggled with moving my app to the physical watch.
Some the key issues:
- let not allowed on watch (ES5)
- variables not initialised when app initially loaded (worked OK in simulator)
- setText with <div id= >
This lead to a surprising amount of different failure modes:
- watch stuck on “restore to a safe state” - requiring a hard factory reset
- app cannot be activated for training - toggle switches back directly
- training starts - watch reboots when changing to app screen
- app screen blank
- once app screen actually comes up it becomes easier to debug

To debug I basically removed all code from my app and inserted it back again code block by block to pinpoint the errors. Took a fair amount of time, but now the app mostly works on the watch too…
Questions - I never managed to locate a log or crash dump from the watch. Where is it?
Some suggestions:
- Would be good if simulator and watch was following the same standard, so more bugs could be found in the simulator, or if there was a “linter” to warn of unsafe usage
- I have found most of my problems touched upon in the documentation, code examples or this forum, but the information is sometimes very brief and not always easy to find, maybe gather everything in the reference document and add a TOC and index
- My own approach is generally top-down, understand architecture, state model and data flow, build a skeleton and iteratively add detail. Documentation is a bit lacking in this high level view, it feels more like a collection of many details and example fragments.
- For me, the intended debug approach is not very clear, maybe add more guidance in the manual on how to use the VS Code IDE especially for debugging.
But kudos for making this IDE available,

-
@matram This sounds way too familiar. I went through the same while developing my apps.
Frustratiing at some point. Especially because it takes a lot of steps to test it on the watch every time.If the watch is connected to your pc, there is an option to look at the logs in the SuuntoPlus extension in VS Code. You can find it in “Explorer -> Suunto Watch”
-
Another frustrating finding is that it seems as if including the zone gauge as done in example “TemplateLayout4” breaks the simulator in a strange way, and exposes what I believe is a memory leak in VS Code editor - that makes it more or less impossible to work. Restart needed, Zone gauge code needs to be removed - and then things are back to normal.
Here is what does not work in simulator:~~
<!-- Zone gauge -->
<import src=“#zone-g” />Works in watch however.It appears a stupid mistake / misunderstanding on my side. Import of the Zone Gauge only retrieves the html - no logic connected; so it does of course not work…
-
@surfboomerang
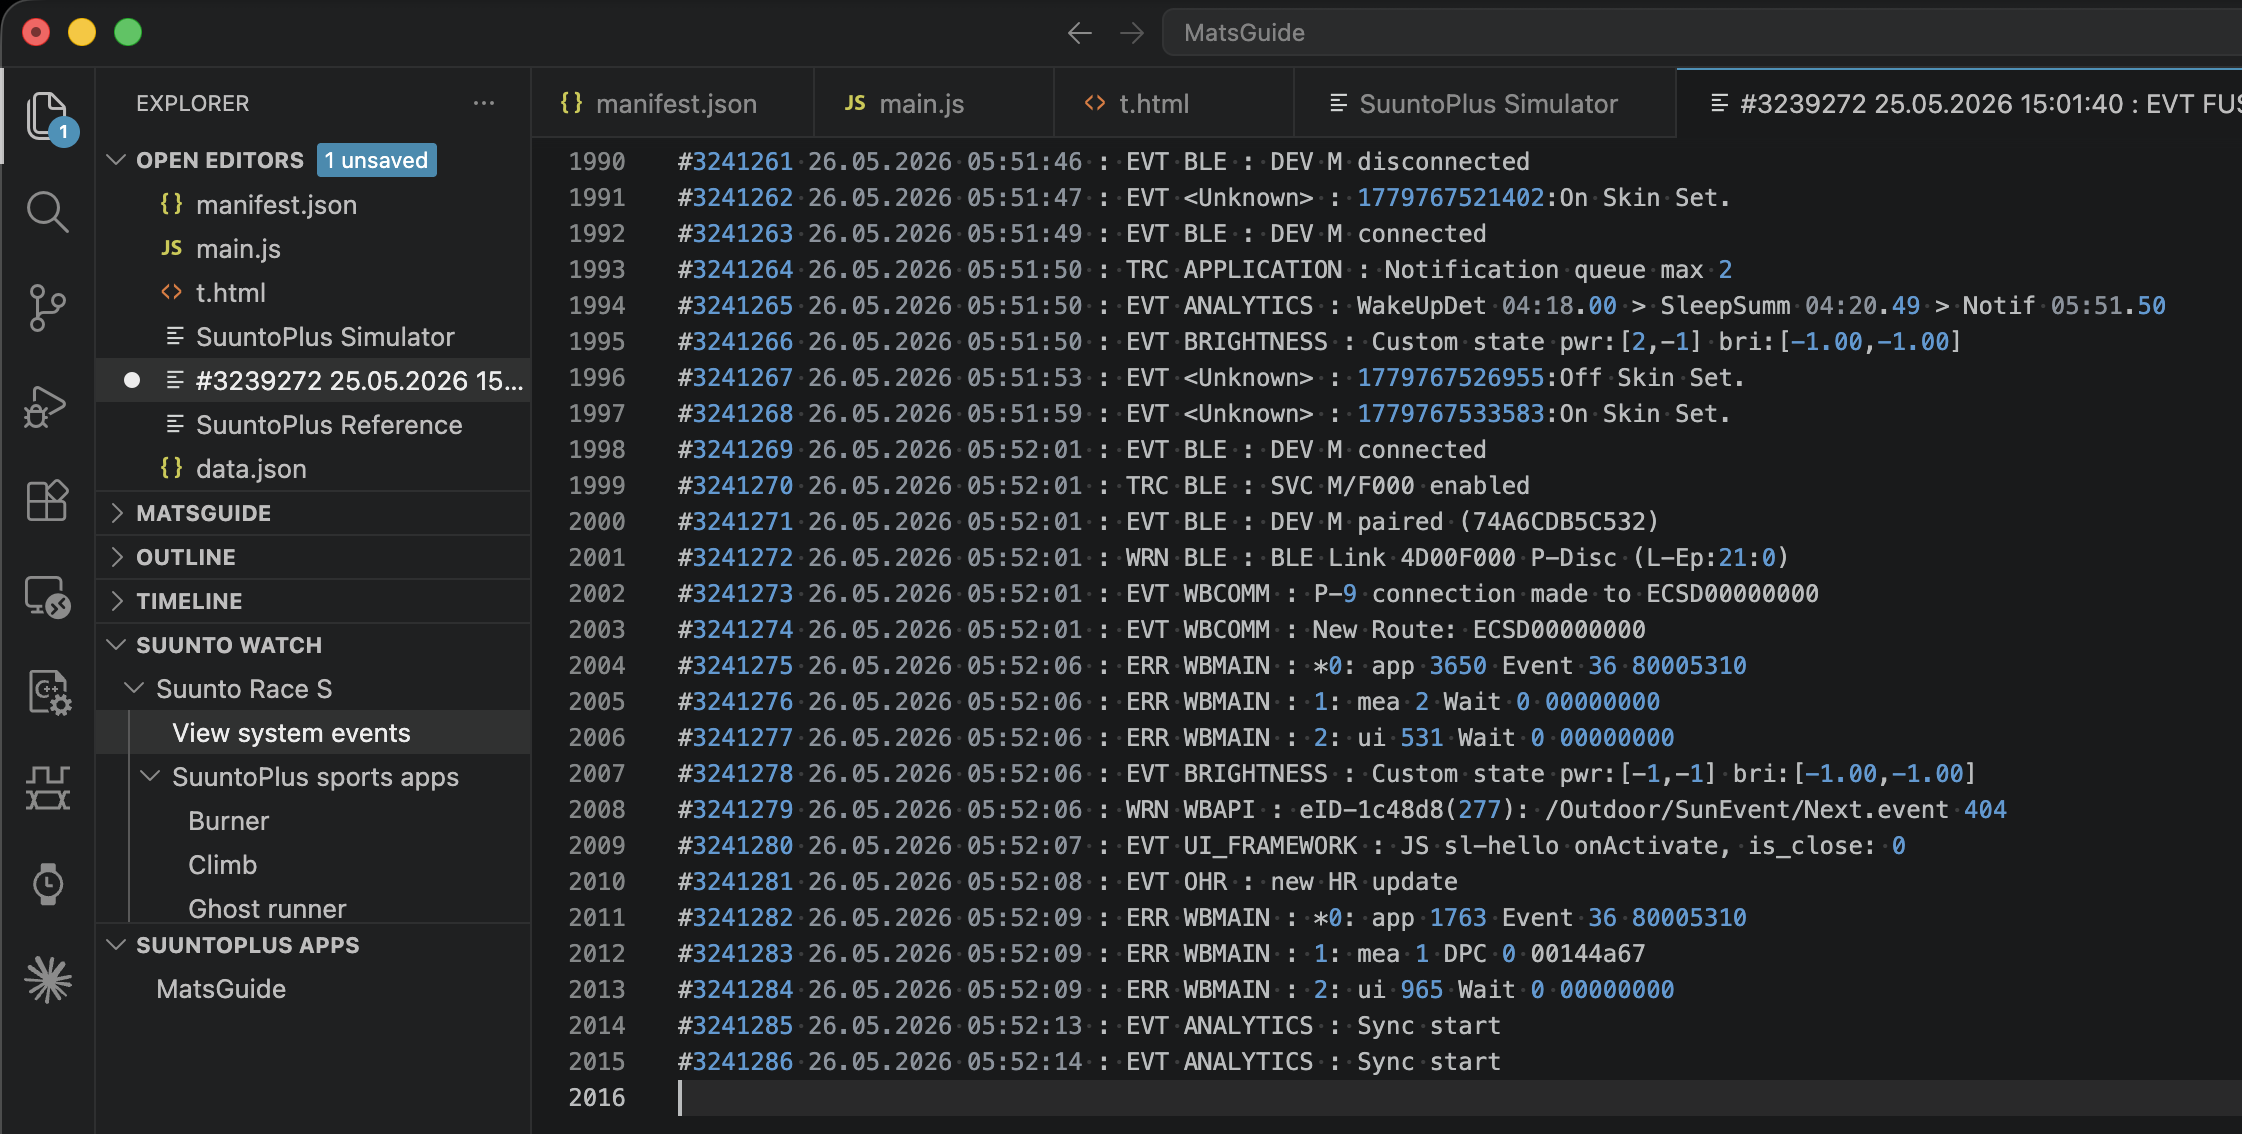
Many thanks.For anyone else, select View system events and you get something like this …
-
One thing that caused my grief when working with subscribed signals (HR, pace) in main.js or in onLoad is that on the simulator signals are always available. On the watch subscribed signals seem to transition from ‘undefined’ -> ‘NaN’ -> a valid number.
I ended up needing to protect any use of these signals by using isFinite(), like this.
  // Get the index of the the active zone for a 5 zone HR gauge
  // v          current value
  // zones      an array of 4-values defining the 5 zones
  function getActiveZone(v, zones) {
    if (!isFinite(v)) return 0;
    for (var i = 1; i < zones.length; i++) {
      if (v < zones[i]) return i - 1;
    }
    return zones.length - 1;
  }
Inserting systemEvent() was quite effective in pinpointing the point of failure once I understood how to do it. But I do not really get any error message, just something like this. [MR] messages are inserted by me, so I can see something happened after “G4a”, but not what the actual error was.
#3251371 26.05.2026 17:44:39 : EVT UI_FRAMEWORK : JS [MR] G1
#3251372 26.05.2026 17:44:39 : EVT UI_FRAMEWORK : JS [MR] G2
#3251373 26.05.2026 17:44:39 : EVT UI_FRAMEWORK : JS [MR] G3
#3251374 26.05.2026 17:44:39 : EVT UI_FRAMEWORK : JS [MR] G4a1-not-supported
#3251375 26.05.2026 17:44:39 : WRN UI_FRAMEWORK : JS
I am more of a Swift or C# person used to verbose error messages and traceback. But maybe I have been spoiled.

Hello! It looks like you're interested in this conversation, but you don't have an account yet.
Getting fed up of having to scroll through the same posts each visit? When you register for an account, you'll always come back to exactly where you were before, and choose to be notified of new replies (either via email, or push notification). You'll also be able to save bookmarks and upvote posts to show your appreciation to other community members.
With your input, this post could be even better 💗
Register Login